アンケート Questionnaire Visualization with R ggplot2
FDアンケート結果の視覚化への挑戦 1。フリーソフトのエディターEmacs, orgmodeとフリーな言語R, ggplot2と遊びながら、情報デザインを考える機会です。
Faculty Development questionnaire results give me a chance to re-visit Edward Tufte's Beautiful Evidence and attempt to implement his design ideas with emacs, org-mode and R, ggplot2.

Emacs org-modeの表には無駄なインクがありません。 簡単に生成するテーブル(表)は木下是雄さんの「レポートの組み立て方 」で見る表に負けなません、 すっきりしている。 The html pages exported by org-mode have a high ink-to-data ratio. They remind me of a book about writing for scientists. (fn:1)

色々なデータ表をブラウザーで一目(one eye-span)で見ることができる。まとめて見えるようにするのが一つの原則(Principle). The browser lets us see several data tables within one eye-span. Orgmode-generated html with some .css styling can implement Edward Tufte's design principle: “one eye-span.”

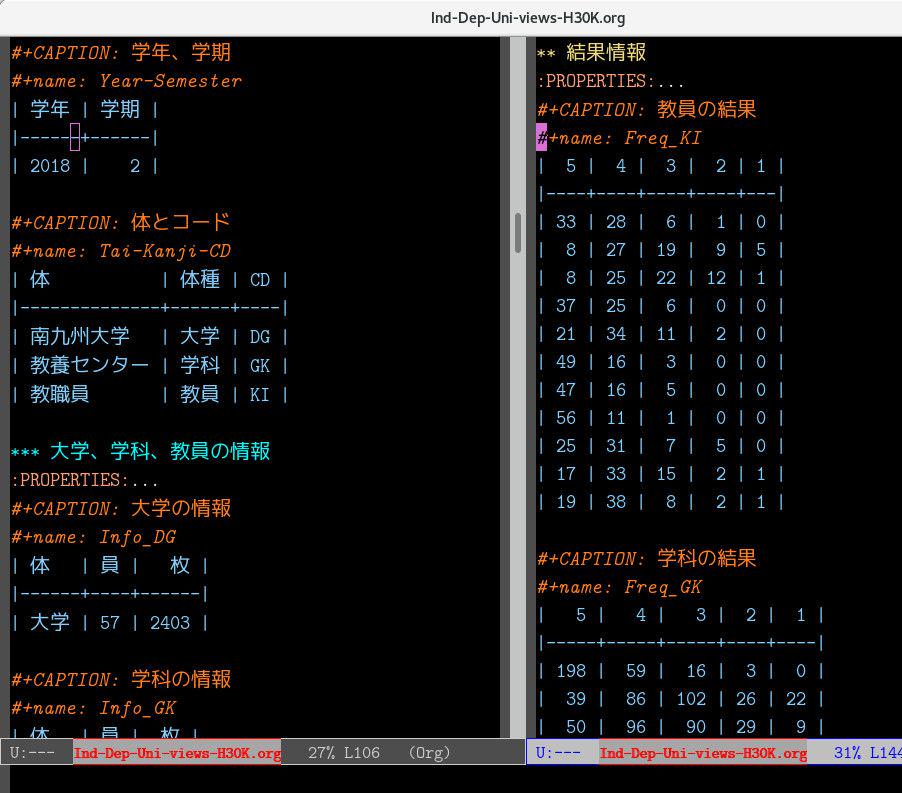
Emacでデータ入力するときは見た目は違う。
In emacs the tables have a different appearance.
Emacs org-mode and R ggplot2 code
It's awkward but it works. It may help to get started thinking about Reproducible Research. (fn:2) エレガントなコードではないけど、動く。
#+TITLE: Combined Views 教員, 学科, 大学
#+STARTUP: showall
#+OPTIONS: toc:nil num:nil timestamp:nil ^:{} H:4

#+HTML_HEAD: <style> @page { size: 210mm 297mm; margin: 4mm; margin-bottom: 6mm; } </style>
#+HTML_HEAD: <style> h1.title { display: none; }  </style>
#+HTML_HEAD: <style> h1, h2, h3, h4 { font-weight: 500; font-size: 1.2em; clear: left;}  </style>
#+HTML_HEAD: <style> div#postamble { display: none; }  </style>

# # doesn't clear the following tables
#+HTML_HEAD: <style> div#outline-container-SetumonJouhou { clear: right; }  </style>
#+HTML_HEAD: <style> div#outline-container-DataJouhou { clear: right; }  </style>
# #+HTML_HEAD: <style> div#outline-container-KekkaJouhou { clear: right; }</style>

#
#+HTML_HEAD: <style> h3 { clear: left; display: none; }  </style>
#+HTML_HEAD: <style> div.outline-3 { clear: left; }  </style>
# #+HTML_HEAD: <style> #outline-container-KekkaJouhou { clear: left; }  </style>

#+HTML_HEAD: <style> table {margin-bottom: 1em; margin-right: 1em; float: left; page-break-inside: avoid;}  </style>
#+HTML_HEAD: <style> span.table-number { display: none; }  </style>
#+HTML_HEAD: <style> span.figure-number { display: none; }  </style>
#+HTML_HEAD: <style> td { padding: 3px; }   </style>

#+HTML_HEAD: <style> table#QuestionTypes { float: left; }  </style>
#+HTML_HEAD: <style> table#ResponseTypes { margin: 1em; clear: right; }  </style>

#+HTML_HEAD: <style> table#Info_DG { float: left; } </style>
#+HTML_HEAD: <style> table#Info_GK { float: left; }  </style>
#+HTML_HEAD: <style> table#Info_KI { float: left; clear: right }  </style>

#+HTML_HEAD: <style> table#Freq_DG { float: left; } </style>
#+HTML_HEAD: <style> table#Freqs_GK { float: left; }  </style>
#+HTML_HEAD: <style> table#Freq_KI { float: left; clear: right }  </style>

#+HTML_HEAD: <style> table#QuestionsAsVariables td { font-size: 10pt; }  </style>

#+HTML_HEAD: <style> table#TidyDataOuput td { font-size: 10pt; }  </style>

#+HTML_HEAD: <style> div#outline-container-TidyData { clear: left; page-break-before: always; }  </style>

#+HTML_HEAD: <style> pre.src, pre.example { border: none; margin: .5em;  box-shadow: none; padding: 0; }  </style>
#+HTML_HEAD: <style> pre.example { margin-left: 4em; padding-left: 1em; border-left: thin solid grey; }  </style>

#+HTML_HEAD: <style> div#outline-container-Data h2 { display: none; }  </style>

#+HTML_HEAD: <style> div.org-src-container { clear: left; }  </style>
# #+HTML_HEAD: <style> img { width: 100%; }  </style>
# adjust width of image to fit on pages under frequency data tables
#+HTML_HEAD: <style> img { width: 700px; } </style>

* 設問情報
:PROPERTIES:
:CUSTOM_ID: SetsumonJouhou
:END:

** 質問
#+CAPTION: Questions
#+name: Questions
| 種略     | 問略 | 問文                                                                  |
|----------+------+-----------------------------------------------------------------------|
| 学生取組 | 出席 | 私はこの授業によく出席した                                            |
| 学生取組 | 発言 | 私は授業内容について質問や発言した                                    |
| 学生取組 | 取組 | 私はこの科目に積極的に取り組んだ(予習と復習した)                    |
| 教員実施 | 聞取 | 教員の声は聞き取りやすかった。                                        |
| 教員実施 | 資料 | 教員の板書(またはPPT・配布資料など)は読みやすかった(見やすかった) |
| 教員実施 | 時刻 | 教員は授業の開始・終了の時刻を守ろうとしていた                        |
| 教員実施 | 反応 | 教員は学生の反応を確かめながら授業を進めていた                        |
| 教員実施 | 熱意 | 教員は熱意を持って授業をしていた                                      |
| 総合評価 | 理解 | 私はこの授業内容を理解できた                                          |
| 総合評価 | 役立 | 私はこの授業で学んだ内容はなんらかの形で将来的に役立つと感じた        |
| 総合評価 | 満足 | 私は総合的に判断してこの授業で満足が得られた                          |

** 質問と回答の分類
#+CAPTION: Question Types
#+name: QuestionTypes
| 種略     | 種文                           |
|----------+--------------------------------|
| 学生取組 | 学生の授業取り組みに関する質問 |
| 教員実施 | 教員の授業実施方法に関する質問 |
| 総合評価 | 総合的評価に関する質問         |

#+CAPTION: Response Types
#+name: ResponseTypes
| 答種 | L | 答略   | 答文               |
|------+---+--------+--------------------|
| SO   | 5 | 特に   | 特にそう思う       |
| SO   | 4 | 多少   | 多少そう思う       |
| DO   | 3 | どちも | どちらともいえない |
| NO   | 2 | あまり | あまりそう思わない |
| NO   | 1 | 全く   | 全くそう思わない   |

* データ情報
:PROPERTIES:
:CUSTOM_ID: DataJouhou
:END:

*** 情報の表
:PROPERTIES:
:CUSTOM_ID: Info_Tables
:END:

#+CAPTION: 学年、学期
#+name: Year-Semester
| 学年 | 学期 |
|------+------|
| 2018 |    2 |

#+CAPTION: 体とコード
#+name: Tai-Kanji-CD
| 体           | 体種 | CD |
|--------------+------+----|
| 南九州大学   | 大学 | DG |
| 教養センター | 学科 | GK |
| 教職員       | 教員 | KI |

*** 大学、学科、教員の情報
:PROPERTIES:
:CUSTOM_ID: EntityDataJouhou
:END:
#+CAPTION: 大学の情報
#+name: Info_DG
| 体   | 員 |   枚 |
|------+----+------|
| 大学 | 57 | 2403 |

#+CAPTION: 学科の情報
#+name: Info_GK
| 体   | 員 |  枚 |
|------+----+-----|
| 学科 |  6 | 276 |

#+CAPTION: 教員の情報
#+name: Info_KI
| 体   | 員 | 枚 |
|------+----+----|
| 教員 |  1 | 68 |

** 結果情報
:PROPERTIES:
:CUSTOM_ID: KekkaJouhou
:END:
#+CAPTION: 教員の結果
#+name: Freq_KI
|  5 |  4 |  3 |  2 | 1 |
|----+----+----+----+---|
| 33 | 28 |  6 |  1 | 0 |
|  8 | 27 | 19 |  9 | 5 |
|  8 | 25 | 22 | 12 | 1 |
| 37 | 25 |  6 |  0 | 0 |
| 21 | 34 | 11 |  2 | 0 |
| 49 | 16 |  3 |  0 | 0 |
| 47 | 16 |  5 |  0 | 0 |
| 56 | 11 |  1 |  0 | 0 |
| 25 | 31 |  7 |  5 | 0 |
| 17 | 33 | 15 |  2 | 1 |
| 19 | 38 |  8 |  2 | 1 |

#+CAPTION: 学科の結果
#+name: Freq_GK
|   5 |   4 |   3 |  2 |  1 |
|-----+-----+-----+----+----|
| 198 |  59 |  16 |  3 |  0 |
|  39 |  86 | 102 | 26 | 22 |
|  50 |  96 |  90 | 29 |  9 |
| 130 |  91 |  40 | 10 |  4 |
|  98 | 107 |  55 | 12 |  3 |
| 174 |  70 |  26 |  4 |  2 |
| 125 |  95 |  48 |  5 |  3 |
| 161 |  81 |  30 |  2 |  1 |
|  99 | 114 |  45 | 13 |  5 |
|  95 | 105 |  65 |  8 |  3 |
|  89 | 120 |  51 |  9 |  7 |

#+CAPTION: 大学の結果
#+name: Freq_DG
|    5 |   4 |   3 |   2 |   1 |
|------+-----+-----+-----+-----|
| 1689 | 479 | 202 |  31 |  10 |
|  419 | 616 | 974 | 190 | 199 |
|  684 | 822 | 692 | 134 |  65 |
| 1341 | 670 | 293 |  69 |  28 |
| 1200 | 695 | 374 |  86 |  42 |
| 1702 | 480 | 169 |  28 |  17 |
| 1315 | 652 | 349 |  52 |  33 |
| 1537 | 585 | 236 |  21 |  19 |
|  938 | 940 | 412 |  73 |  34 |
| 1328 | 676 | 325 |  43 |  26 |
| 1172 | 781 | 356 |  55 |  34 |

** データ視覚化の画像
#+RESULTS: WariQTypeFacets
[[file:KI_GK_DG_Facets-H30K.png]]

* Code for Image: Data Visualization
:PROPERTIES:
:CUSTOM_ID: Images-Data-Visualizations
:END:

#+name: evaluate-now
#+BEGIN_SRC emacs-lisp
(setq org-confirm-babel-evaluate nil)
#+END_SRC

#+RESULTS: evaluate-now

#+name: R-Libraries
#+BEGIN_SRC R  :session Rinddepuni :results silent
library(tidyverse)
library(stringr)
library(ggrepel)
library(forcats)
#+END_SRC

#+name: Convenience-Functions
#+BEGIN_SRC R  :session Rinddepuni
# # Maintain order of data from original tables
FctOrd <- function(col) {
  col <- factor(col, levels=unique(col))
  }

# Remove Part from Group
# # Minus Prt$`5` 4 3 2 1 from Grp$`5`
RemPRT <- function(Grp, Prt) {
  nGRP <- Grp
  nGRP$`X5` <- Grp$`X5` - Prt$`X5`
  nGRP$`X4` <- Grp$`X4` - Prt$`X4`
  nGRP$`X3` <- Grp$`X3` - Prt$`X3`
  nGRP$`X2` <- Grp$`X2` - Prt$`X2`
  nGRP$`X1` <- Grp$`X1` - Prt$`X1`
  nGRP
  }

# # combine data from info tables with frequency data
add_info <- function(Frq, Info) {
  for( i in seq_along(Info)) {
    Frq <- add_column(Frq, !!names(Info)[[i]] := Info[[i]])
  }
  Frq
}
#+END_SRC

#+RESULTS: Convenience-Functions


#+CAPTION: Question and Response Metadata Preparation
#+name: Question-Response-metadata
#+BEGIN_SRC R :session Rinddepuni :var Qs=Questions QTypes=QuestionTypes :colnames yes
# :session Rinddepuni :var Qs=Questions QuesTypes=QuestionTypes :results silent
# # Question Table Preparation
# Keep the dataframe/tibble order the same as in the original table
# /R For Data Science/ Hadley Wickham p. 225
# # "Sometimes you'd prefer that the order of the levels match the order
# # of the first appearance in the data. You can do that when creating the
# # factor by setting levels to \unique(x) \ ...
Qs$問略 <- factor(Qs$問略, levels = unique(Qs$問略))

Qs$種略 <- FctOrd(Qs$種略)
Qs$問文 <- FctOrd(Qs$問文)
# as.tibble(Qs)
# # A tibble: 11 x 3
#        種略   問略
#      <fctr> <fctr>
# # ... with 1 more variables: 問文 <fctr>

# http://r-statistics.co/Top50-Ggplot2-Visualizations-MasterList-R-Code.html
# # "...  Just sorting the dataframe by the variable of interest
# isn’t enough to order the bar chart. In order for the bar chart to
# retain the order of the rows, the X axis variable (i.e. the
# categories) has to be converted into a factor."
Qs[1:3,]
#+END_SRC
#+RESULTS: Question-Response-metadata
| 種略     | 問略 | 問文                                               |
|----------+------+----------------------------------------------------|
| 学生取組 | 出席 | 私はこの授業によく出席した                         |
| 学生取組 | 発言 | 私は授業内容について質問や発言した                 |
| 学生取組 | 取組 | 私はこの科目に積極的に取り組んだ(予習と復習した) |

#+name: RemoveParts
#+BEGIN_SRC R :session Rinddepuni :var  I_DG=Info_DG F_DG=Freq_DG I_GK=Info_GK F_GK=Freq_GK I_KI=Info_KI F_KI=Freq_KI :colnames yes
# :session Rinddepuni
# :var I_DG=Info_DG F_DG=Freq_DG I_GK=Info_GK
# # F_GK=Freq_GK I_KI=Info_KI F_KI=Freq_KI :colnames yes

# Remove GK学科 Department numbers part from DG大学 University
# # Frequencies of DG les GK, University minus Department
F_DGlGK <- RemPRT(F_DG, F_GK)
# remove KI教員 Teacher numbers fom GK学科 Department
# # Frequency of GK less KI, Department minus Teacher
F_GKlKI <- RemPRT(F_GK, F_KI)
F_DGlGK[1:3,]
#+END_SRC
#+RESULTS: RemoveParts
|   X5 |  X4 |  X3 |  X2 |  X1 |
|------+-----+-----+-----+-----|
| 1491 | 420 | 186 |  28 |  10 |
|  380 | 530 | 872 | 164 | 177 |
|  634 | 726 | 602 | 105 |  56 |

#+name: AddInfoToFrequencies
#+BEGIN_SRC R :session Rinddepuni  :colnames yes :var sem=Year-Semester
# as.tibble(F_DGlGK)
# # A tibble: 11 x 5
#       X5    X4    X3    X2    X1
#    <int> <int> <int> <int> <int>

F_DGlGK <- add_info(F_DGlGK, I_DG)
F_DGlGK <- add_info(F_DGlGK, sem)
F_GKlKI <- add_info(F_GKlKI, I_GK)
F_GKlKI <- add_info(F_GKlKI, sem)
F_KI <- add_info(F_KI, I_KI)
F_KI <- add_info(F_KI, sem)
F_DGlGK[1:3,]

# as.tibble(F_DGlGK)
# # A tibble: 11 x 10
#       X5    X4    X3    X2    X1    体    員    枚  学年  学期
#    <int> <int> <int> <int> <int> <chr> <int> <int> <int> <int>
#+END_SRC

#+RESULTS: AddInfoToFrequencies
|   X5 |  X4 |  X3 |  X2 |  X1 | 体   | 員 |   枚 | 学年 | 学期 |
|------+-----+-----+-----+-----+------+----+------+------+------|
| 1491 | 420 | 186 |  28 |  10 | 大学 | 57 | 2403 | 2017 |    2 |
|  380 | 530 | 872 | 164 | 177 | 大学 | 57 | 2403 | 2017 |    2 |
|  634 | 726 | 602 | 105 |  56 | 大学 | 57 | 2403 | 2017 |    2 |

#+name: AddFactorsToFrequencies
#+BEGIN_SRC R :session Rinddepuni :colnames yes
F_DGlGK <- add_info(F_DGlGK, Qs)
F_GKlKI <- add_info(F_GKlKI, Qs)
F_KI <- add_info(F_KI, Qs)

F_DGlGK[1:3,]
#+END_SRC

#+RESULTS: AddFactorsToFrequencies
|   X5 |  X4 |  X3 |  X2 |  X1 | 体   | 員 |   枚 | 学年 | 学期 | 種略     | 問略 | 問文                                               |
|------+-----+-----+-----+-----+------+----+------+------+------+----------+------+----------------------------------------------------|
| 1491 | 420 | 186 |  28 |  10 | 大学 | 57 | 2403 | 2017 |    2 | 学生取組 | 出席 | 私はこの授業によく出席した                         |
|  380 | 530 | 872 | 164 | 177 | 大学 | 57 | 2403 | 2017 |    2 | 学生取組 | 発言 | 私は授業内容について質問や発言した                 |
|  634 | 726 | 602 | 105 |  56 | 大学 | 57 | 2403 | 2017 |    2 | 学生取組 | 取組 | 私はこの科目に積極的に取り組んだ(予習と復習した) |

#+name: ResponseFactorPrep
#+BEGIN_SRC R :session Rinddepuni :var RespTypes=ResponseTypes :colnames yes
# as.tibble(RespTypes)
# # A tibble: 5 x 4
#    答種     L   答略               答文
#   <chr> <int>  <chr>              <chr>
# 1    SO     5   特に       特にそう思う

RespTypes$答略 <- FctOrd(RespTypes$答略)
RespTypes$答文 <- FctOrd(RespTypes$答文)
RespTypes$答種 <- FctOrd(RespTypes$答種)

# as.tibble(RespTypes)
# # A tibble: 5 x 4
#     答種     L   答略               答文
#   <fctr> <int> <fctr>             <fctr>
# 1     SO     5   特に       特にそう思う
RespTypes[1:3,]
#+END_SRC

#+RESULTS: ResponseFactorPrep
| 答種 | L | 答略   | 答文               |
|------+---+--------+--------------------|
| SO   | 5 | 特に   | 特にそう思う       |
| SO   | 4 | 多少   | 多少そう思う       |
| DO   | 3 | どちも | どちらともいえない |

#+name: FreqFactorsToLongForm
#+BEGIN_SRC R :session Rinddepuni :colnames yes
# #+name: FreqFactorsToLongForm
# #  R :session Rinddepuni
# Get df/tibbles for Uni, Dep, and Individual ready
# # Get into Long Format, create a function here later
RLevels <- str_c("X", RespTypes$L)
Long_DGlGK <- F_DGlGK %>% gather( RLevels, key=回答, value = 頻度)

Long_DGlGK$回答 <- factor(Long_DGlGK$回答, order=TRUE,
                levels = rev(RLevels), labels=rev(RespTypes$答略))

Long_GKlKI <- F_GKlKI %>% gather(RLevels, key=回答, value = 頻度)
Long_GKlKI$回答 <- factor(Long_GKlKI$回答, order=TRUE,
                levels = rev(RLevels), labels=rev(RespTypes$答略))

Long_KI <- F_KI %>% gather(RLevels, key=回答, value = 頻度)
Long_KI$回答 <- factor(Long_KI$回答, order=TRUE,
                levels = rev(RLevels), labels=rev(RespTypes$答略))

# # merge Uni(DGlGK) and Dep(GKlKI)
DGlGK_GKlKI <- union(Long_DGlGK, Long_GKlKI)

# With this the data is ready to facet by entity $体
# # and see together with viewports
DGlGK_GKlKI_KI <- union(DGlGK_GKlKI, Long_KI)
# # factor the entity-type:体 to keep the faceting in order from
# # smallscale (individual 教員) to largest scale (university 大学)
DGlGK_GKlKI_KI$体  <- factor(DGlGK_GKlKI_KI$体 , order=TRUE, levels=c("教員", "学科", "大学"))
DGlGK_GKlKI_KI <- DGlGK_GKlKI_KI %>% mutate(割 = round(頻度 / 枚 * 100, digit = 1))
DGlGK_GKlKI_KI[1:4,]
#+END_SRC
#+RESULTS: FreqFactorsToLongForm
| 体   | 員 | 枚 | 学年 | 学期 | 種略     | 問略 | 問文                                                           | 回答 | 頻度 |  割 |
|------+----+----+------+------+----------+------+----------------------------------------------------------------+------+------+-----|
| 教員 |  1 | 68 | 2017 |    2 | 総合評価 | 満足 | 私は総合的に判断してこの授業で満足が得られた                   | 全く |    1 | 1.5 |
| 教員 |  1 | 68 | 2017 |    2 | 総合評価 | 役立 | 私はこの授業で学んだ内容はなんらかの形で将来的に役立つと感じた | 全く |    1 | 1.5 |
| 教員 |  1 | 68 | 2017 |    2 | 教員実施 | 反応 | 教員は学生の反応を確かめながら授業を進めていた                 | 全く |    0 |   0 |
| 教員 |  1 | 68 | 2017 |    2 | 教員実施 | 熱意 | 教員は熱意を持って授業をしていた                               | 全く |    0 |   0 |

#+CAPTION: Question Type Faceting with Individual and Groups
#+name: WariQTypeFacets
#+BEGIN_SRC R :session Rinddepuni :results graphics :file KI_GK_DG_Facets-H30K.png :var fl="KI_GK_DG_Facets-H30K.png" :exports both
# :session Rinddepuni :results graphics :file KI_GK_DG_Facets.png
# :var fl="KI_GK_DG_Facets.png" :exports both
# # Keep facets in order Ind -> Dep -> Uni 教員 -> 学科 -> 大学
# DGlGK_GKlKI_KI$体 <- factor(DGlGK_GKlKI_KI$体, order=TRUE, levels=c(1, 2, 3), labels =c("教員", "学科", "大学"))
# DGlGK_GKlKI_KI$体 <- FctOrd(DGlGK_GKlKI_KI$体)
png(file=fl, width = 1800, height = 1800 , res = 144)
ggplot(DGlGK_GKlKI_KI, aes(回答, 割)) +
 geom_point(aes(group = 問略, color=問略, shape=問略), size = 3) +
 scale_shape_manual(values = 1:nlevels(DGlGK_GKlKI_KI$問略)) +
 geom_line (aes(group = 問略, color=問略)) +
 # replace legends with ggrepel labes for 5 level response "特に"
 ggrepel::geom_label_repel (data=filter(DGlGK_GKlKI_KI, 回答 == "特に"),aes(label = str_c(問略, 頻度, 割, "%", sep=": ")), label.size = NA, segment.color = "grey", nudge_y = 40, nudge_x = -1) +
 ggrepel::geom_label_repel (data=filter(DGlGK_GKlKI_KI, 回答 == "あまり"), aes(label = str_c(問略, 頻度, 割, "%", sep=": ")), label.size = NA, segment.color = "grey", nudge_y = 40, nudge_x = -5) +
 theme(
      axis.title = element_text (size = rel(.9)),
      axis.text.x = element_text (size = rel(1.2), angle = 45),
      axis.title.y = element_text (angle = 0),
      strip.text = element_text (size = rel(1.5)),
      plot.title = element_text(size = rel(1.5), color="black"),
      legend.title = element_text(rel(4)),
      legend.text  = element_text(size=12)) +
 labs( title = paste( "教員,学科,大学のアンケート結果%"),
      color= "設問", shape="設問" ) +
# # replace labs labels with ggrepel above
 facet_wrap( 種略 ~ 体 , ncol = 3, nrow = 3) +
  ylim( -10 , 110) +
  guides(color=FALSE, shape=FALSE)

  dev.off()
 #+END_SRC
- るびきち: 巨大なオーガナイズシステム「org-mode」の世界
- (fn:1) I mentioned Koreo Kinoshita's books in a post about using Guile Scheme to implement D.R.Y. for teachers
- (fn:2) Reproducible Research: