Racket Plot: Minamata Disease Certification Figures
The figures provide only a slight hint for the imagination to get started in an attempt to guess at the pain and turmoil involved in living with methyl mercury poisoning and then applying for relief from corporate and government bureaucracy.

Code and Data for the visualization are below.
Paul Farmer, in Pathologies of Power, shows how it is the self-effacing poor (Amartya Sen would say they lack “agency”) who suffer most from disease, from dams, from soldiers and from bureaucrats. In Minamata we see the same pattern with contaminants and corporations.
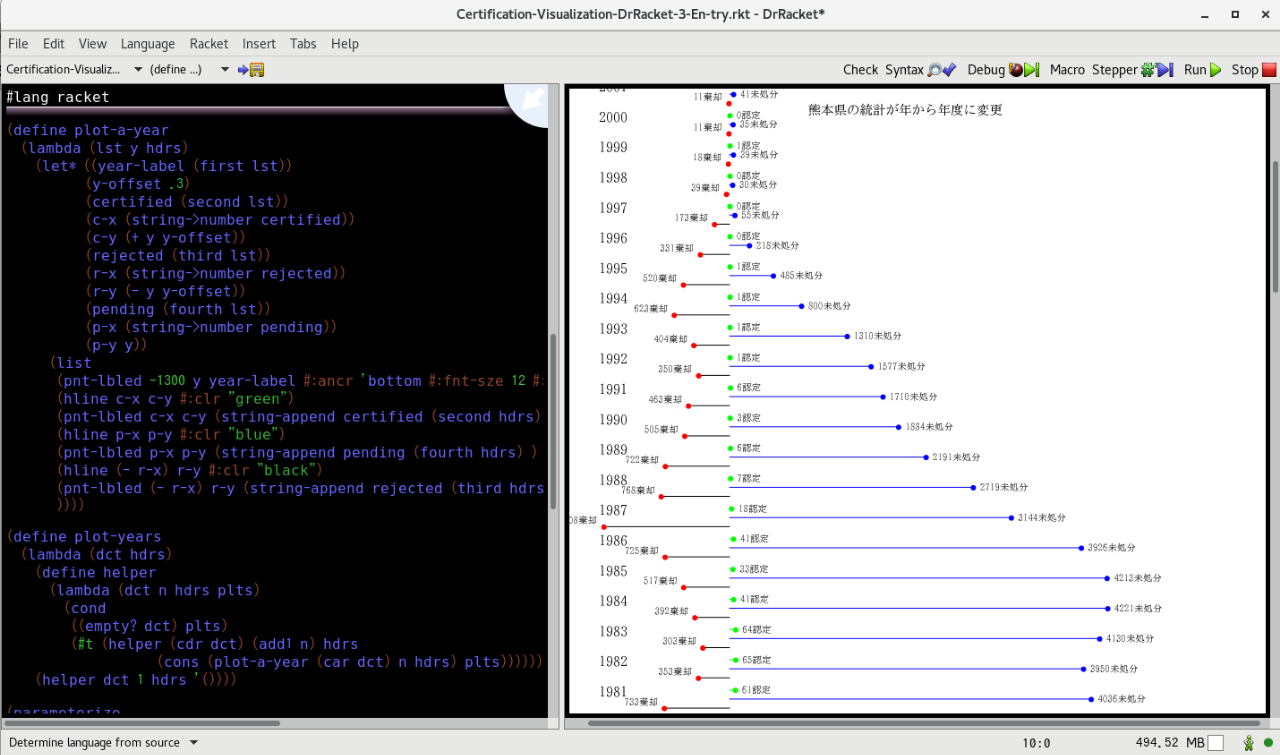
Here's an attempt at proof that the code worked in DrRacket:

And here is the Japanese version:

code
#lang racket
;; for DrRacket use: (current-directory-for-user “/home/brian/Racket/Minamata-Data/”)
(define Data-File “Certification-Data-Minamata-1-edt.csv”) ;; “Certification-Data-Minamata-1.csv”) ;; note: “33”,“年度”,“熊本県の統計が年から年度に変更”,“熊本県の統計が年から年度に変更”,“熊本県の統計が年から年度に変更”
;;; open Data File, read the file and convert it ;;; ; to dictionary-like list (define get-path (lambda (file-name) (build-path (current-directory-for-user) file-name)))
(define get-data (lambda (pth) (let* ((inp (open-input-file pth)) (lines (port->lines inp))) (close-input-port inp) (map (lambda (s) (string-split (regexp-replace* “\“” s “”) “,”)) lines))))
(define csvf->dict (lambda (file-name) (get-data (get-path file-name))))
(define Cert-Data-Dict (csvf->dict Data-File))
(define headers (first Cert-Data-Dict)) (define Cert-Labels (map cdr (cdr Cert-Data-Dict)))
(require plot) (require plot/utils)
(define hline (lambda (x y #:clr (clr “black”)) ;; lne-wdh lne-stl ..etc (lines (list (vector 0 y) (vector x y)) #:color clr)))
(define pnt-lbled (lambda (x y l #:ancr (ancr 'left) #:fnt-sze (fnt-sze 8) #:pnt-clr (pnt-clr 0) #:lbl-angl (lbl-angl 0) #:pnt-sze (pnt-sze 5)) (point-label (vector x y) l #:anchor ancr #:size fnt-sze #:point-color pnt-clr #:angle lbl-angl #:point-size pnt-sze)))
(define plot-a-year (lambda (lst y hdrs) (let* ((year-label (first lst)) (y-offset .3) (certified (second lst)) (c-x (string->number certified)) (c-y (+ y y-offset)) (rejected (third lst)) (r-x (string->number rejected)) (r-y (– y y-offset)) (pending (fourth lst)) (p-x (string->number pending)) (p-y y)) (list (pnt-lbled -1300 y year-label #:ancr 'bottom #:fnt-sze 12 #:pnt-sze 0) (hline c-x c-y #:clr “green”) (pnt-lbled c-x c-y (string-append certified (second hdrs) ) #:pnt-clr “green”) (hline p-x p-y #:clr “blue”) (pnt-lbled p-x p-y (string-append pending (fourth hdrs) ) #:pnt-clr “blue”) (hline (– r-x) r-y #:clr “black”) (pnt-lbled (– r-x) r-y (string-append rejected (third hdrs) ) #:ancr 'bottom-right #:pnt-clr “red”) ))))
(define plot-years (lambda (dct hdrs) (define helper (lambda (dct n hdrs plts) (cond ((empty? dct) plts) (#t (helper (cdr dct) (add1 n) hdrs (cons (plot-a-year (car dct) n hdrs) plts)))))) (helper dct 1 hdrs '())))
(parameterize ((plot-title “熊本県認定審査処分状況の推移”) (plot-x-label “Source: 相思社のオンライン資料: http://www.soshisha.org") (plot-x-axis? #f) (plot-x-far-axis? #f) (plot-y-label #f) (plot-y-far-axis? #f) (plot-y-ticks no-ticks)) (plot (list (plot-years Cert-Labels headers) (pnt-lbled 800 32.5 “熊本県の統計が年から年度に変更” #:pnt-sze 0 #:fnt-sze 11)) #:x-min -2000 #:x-max 6000 #:y-min -1 #:y-max (add1 (length Cert-Labels)) #:width 800 #:height 1500 #:out-file “Kumamoto-Certification-Visualization-Ja-1.png” #:out-kind 'png ))
(define headers-en '(“Year” “Certified” “Rejected” “UnProcessed”))
(parameterize ((plot-title “Kumamoto Prefecture Minamata Disease Certification Figures”) (plot-x-label “Source: Soshisha's Online Materials: http://www.soshisha.org") (plot-x-axis? #f) (plot-x-far-axis? #f) (plot-y-label #f) (plot-y-far-axis? #f) (plot-y-ticks no-ticks)) (plot (list (plot-years Cert-Labels headers-en) (pnt-lbled 800 32.5 “Prefectures changes date system?” #:pnt-sze 0 #:fnt-sze 11)) #:x-min -2200 ;; changed from Ja, Kanji takes less space #:x-max 6000 #:y-min -1 #:y-max (add1 (length Cert-Labels)) #:width 800 #:height 1500 #:out-file “Kumamoto-Certification-Visualization-En-1.png” #:out-kind 'png ))
data
“”,“年”,“認定”,“棄却”,“未処分” “1”,“1969以前”,“44”,“0”,“0” “2”,“1970”,“72”,“2”,“28” “3”,“1971”,“58”,“1”,“136” “4”,“1972”,“154”,“10”,“411” “5”,“1973”,“298”,“40”,“1968” “6”,“1974”,“73”,“22”,“2628” “7”,“1975”,“128”,“24”,“2949” “8”,“1976”,“104”,“84”,“3360” “9”,“1977”,“180”,“98”,“4171” “10”,“1978”,“143”,“296”,“4695” “11”,“1979”,“117”,“601”,“4666” “12”,“1980”,“51”,“800”,“4416” “13”,“1981”,“61”,“733”,“4036” “14”,“1982”,“65”,“353”,“3950” “15”,“1983”,“64”,“303”,“4130” “16”,“1984”,“41”,“392”,“4221” “17”,“1985”,“33”,“517”,“4213” “18”,“1986”,“41”,“725”,“3926” “19”,“1987”,“18”,“1408”,“3144” “20”,“1988”,“7”,“768”,“2719” “21”,“1989”,“6”,“722”,“2191” “22”,“1990”,“3”,“505”,“1884” “23”,“1991”,“6”,“463”,“1710” “24”,“1992”,“1”,“350”,“1577” “25”,“1993”,“1”,“404”,“1310” “26”,“1994”,“1”,“623”,“800” “27”,“1995”,“1”,“520”,“485” “28”,“1996”,“0”,“331”,“218” “29”,“1997”,“0”,“173”,“55” “30”,“1998”,“0”,“39”,“30” “31”,“1999”,“1”,“18”,“39” “32”,“2000”,“0”,“11”,“35” “34”,“2001”,“0”,“11”,“41” “35”,“2002”,“0”,“28”,“22” “36”,“2003”,“0”,“12”,“17” “37”,“2004”,“0”,“3”,“755” “38”,“2005”,“0”,“0”,“2,531” “39”,“2006”,“1”,“0”,“3,315” “40”,“2007”,“2”,“5”,“3,730” “41”,“2008”,“0”,“0”,“3,783” “42”,“2009”,“2”,“218”,“4,280”
R gets data from the web
Variable names with “–” do not work in the R language. I should make a littler “r” script that I can use from a DrRacket procedure that takes a url and a number to get table data from an on-line page.
#+name: CertificationData #+BEGINSRC R :results output :exports both :session CertificationMinamata # Unable to use read.table and url when getting a particular table from a webpage require(rvest) dataurl <– “http://www.soshisha.org/jp/aboutmd/masituation/%e6%b0%b4%e4%bf%a3%e7%97%85%e8%aa%8d%e5%ae%9a%e5%af%a9%e6%9f%bb%e9%96%a2%e9%80%a3%e7%b5%b1%e8%a8%88%e8%b3%87%e6%96%99%ef%bc%88%e7%86%8a%e6%9c%ac%e7%9c%8c%e3%83%bb%e9%b9%bf%e5%85%90%e5%b3%b6%e3%81%ae” # “Certification-Data-Soshisha.html” datapage <– readhtml(dataurl) %>% htmlnodes(“table”) %>% htmltable(fill=TRUE) datatable <– datapage[[6]] datatable write.csv(datatable, “Certification-Data-Minamata-1.csv”)