Visual Languages: Social Economy Canvas
This is the third in a series of posts about how to visualize economic networks. After this post, I'll write another comparing those three techniques.
The Social Economy Canvas is a European Community project. Seems to be lots of projects funded by grants from the European Community that are aimed at a better economic system. They must not like the one they got now very much.
The Social Economy Canvas was introduced to the Holo-REA project by Alessandro Rancati.
Alessandro helped to apply the canvas to a Holo-REA user network that was previously used as an example in the Resource Flow diagram blog post. At that time, the network was called Holo-Food, although I think they have renamed themselves to something like Holo-Agriculture.
So here's the Holo-Food canvas.
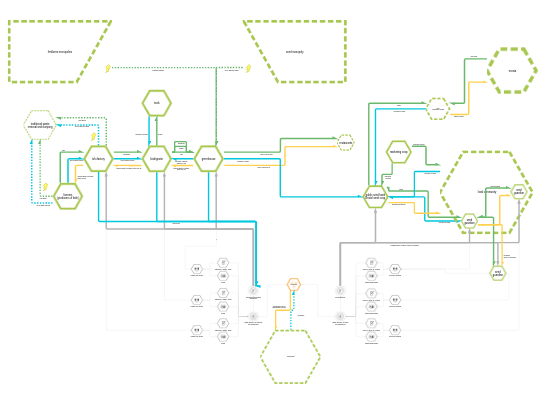
To explore the diagram, scroll down on that page (the hyperlink above the picture) until you see it, hover over the picture, and click the Full Screen button, and then Zoom In (it's huge).
The Social Economy Canvas is complex, and really needed Alessandro to guide the Holo-Food crew through the creation of that diagram. But they thought they learned a lot about their project through that exercise.
And the Canvas has some features not found in the previous visual languages in this series.
For example, notice the lightning bolt in this detail screenprint:
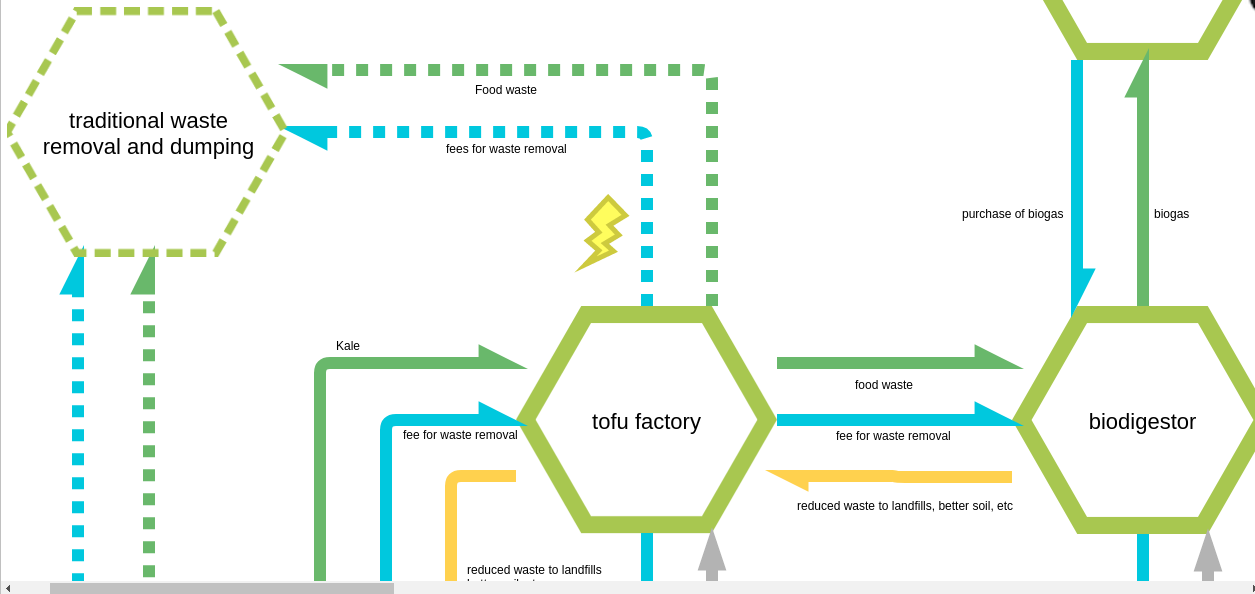
It signals that taking food wastes to the biodigestor eliminates traditional waste removal and dumping. The dump fees go instead to the biodigestor, helping to finance its operation.
Note also the different colors. Each has a meaning. An orange arrow suggests unsustainable practices.
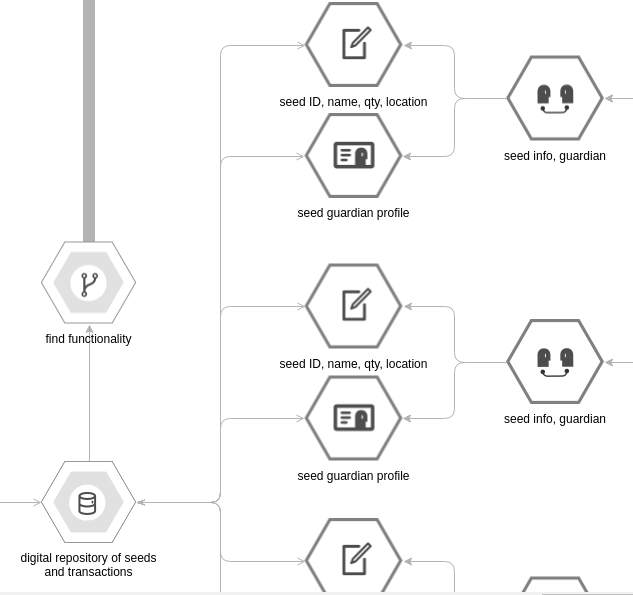
The canvas also gets into functional details, like this section about information for seed guardians:
That's as much detail as I will get into in this blog post, but the Canvas website has a lot more: https://webgate.ec.europa.eu/fpfis/wikis/display/SEC/Tutorials
As you can see from those tutorials, the Canvas provides a lot of documentation and procedures for thinking through all the details of an economic network, which should be particularly useful for a new network that wants to form, but also useful for an existing network that wants to explain itself to itself and others better.
And here's a video showing the Holo-Food crew exploring their diagram:
Next post: comparing resource flow diagrams, commons vs capitalism diagrams, and the Social Economic Canvas.