Agile principles and values can be applied to the way you approach data science projects
Project management methodologies are commonly used to get projects done or a product (or referred as a tool) produced. They are, in general, processes and frameworks which break down the overall objective to individual tasks organised on a timeline. This can be adapted to be used to approach data science projects.
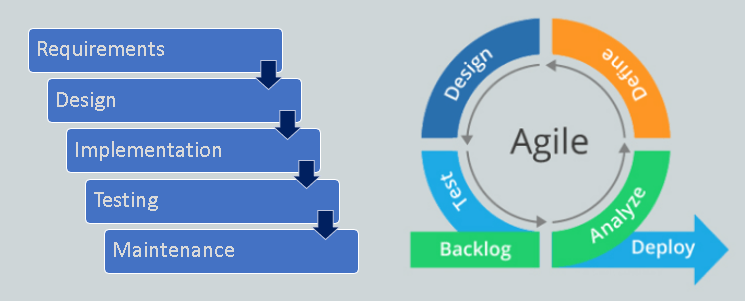
In the past, the traditional Waterfall methodology (dated way back to 1970s) has been very popular. It defines all requirements and parameters of the product at the start, so that the project team can work towards this target in sequential phases. This method has been very suitable for the manufacturing industry where product specifications seldom vary with time. It requires very extensive upfront planning, and ideally, the output product is exactly the same as specified in the beginning.When the Waterfall methodology is becoming unsuitable, many popular project management methodologies have emerged over the years, especially in the software development industry. Let me share the most popular one.

Agile Framework
Agile is a way of working developed in 2001, and is a widely used to manage software development projects. It is suitable for fast-paced development cycles and has provision for specifications change during the design and build process. It is flexible, and strives for iterative incremental improvement in the product through team collaboration. In short, Agile is to plan, build, test, learn, repeat.
Agile teams are responsive to the unpredictable requirements as the project unfolds, through iterative work processes. Below are Agile principles which serve as a framework (guideline) to the way of working:
•Customer satisfaction through early and continuous software delivery
•Accommodate changing requirements throughout the development process
•Frequent delivery of working software, as the working software is the primary measure of progress
•Collaboration and interaction between the business stakeholders (client) and developers (vendor) throughout the project, including face-to-face communication within the development team
•Support, trust, and motivate the people involved
•Agile frameworks to support a consistent development pace
•Attention to technical detail and design enhances agility
•Simplicity in looking for solutions
•Regular reflections in the self-organising team on how to become more effective
Agile projects are characterized by a series of tasks that are conceived, executed and adapted as the situation demands. However, Agile focus is not on what to do, but how to think; it values and places priority on:
•Individuals and interactions (rather than processes and tools)
•Working software (rather than comprehensive documentation)
•Customer collaboration (rather than contract negotiation)
•Responding to change (rather than following a predetermined/fixed plan)

While Agile principles and priorities are employed for greater productivity, most of them could be leveraged for data science (DS) projects. Moreover, data scientists do not know how to schedule the project because it is impossible to determine a specific timeline for the type of “research” and exploratory work. Most DS projects require trial and error by going down different paths and trying different techniques. They do not have an element of certainty in the output, so Agile is most suitable to be adopted to direct the workflow.
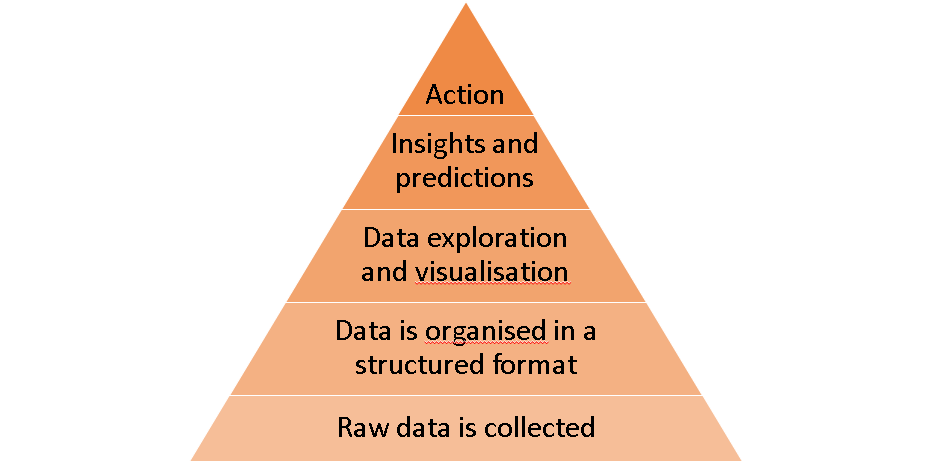
Most other projects deal with what customers want, what the developers want, and what the business seeks. When working with DS, another perspective is added: what the data is telling you. Data scientists cannot make any sense out of the data unless they develop a basic understanding of it. There is a lot of investigation, exploration, testing and tuning. Agile uses the concept of iteration and constant feedback in order to refine a system under development, in order to move up the Data-Value Pyramid.
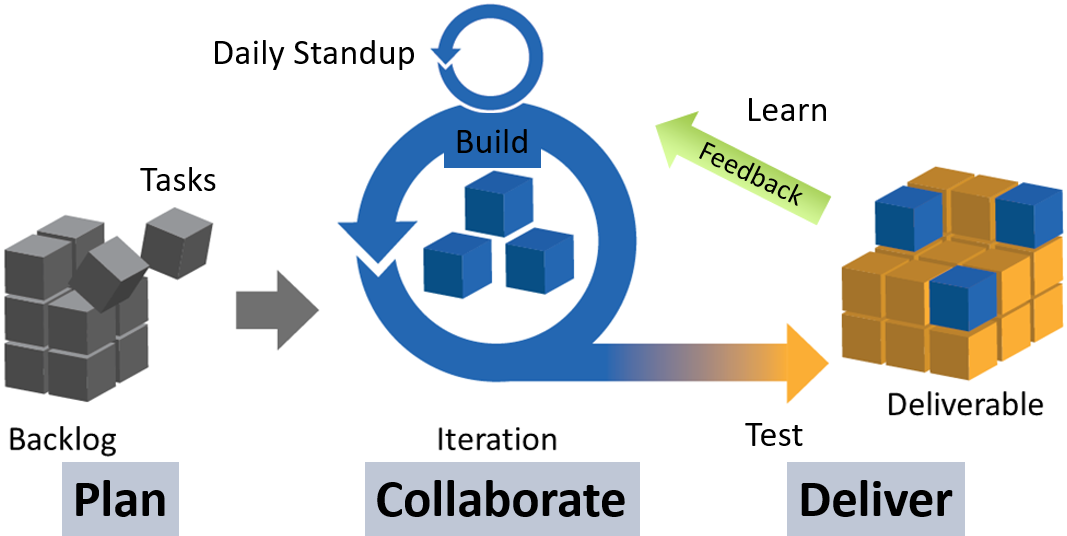
When working on DS projects, insights are not immediately achievable; multiple iterations are needed before any insights can be discovered. I will explain the main Agile working practices (Scrum framework), and how they can be applied to DS:
1. Define the business need and the project objective. This is usually driven by the product owner who is responsible for the product features and quality. It is the big picture stuff, but this is the core belief that you will refer back to as you build. In DS, the product owner could be the client, the business, or the end customer (for example, end user of a prediction tool). Understand what problems the product owner is facing and tailor the project proposal to meet their needs.
2. Build the backlog. Focusing on the user requirements (“user stories” in Agile), a list of tasks is derived to accomplish to build product features or improve product performance. The DS team builds the backlog together with the product owner to determine the product features and performance targets. The backlog could start from getting the data in the structured way before they can be analysed. Then it could be a list for feature selection or feature engineering, or a list of models to select, tune and optimise.
3. Prioritise the backlog, identify the backlog tasks which will bring the most value with the least effort. In DS, not every approach is worth trying, so cover the most promising ones first. When the main ones are conveyed, you might find that the remaining others are not as important as initially thought.
4. Do a sprint (the actual development work). Sprints are usually two-weeks cycles where high priority tasks on the backlog are worked on. In DS, each sprint could be two to four weeks depending on the team size. During the sprint, always complete the task with the highest priority before moving on to the next in line.
5. Have daily standups. Standup meetings are for team members to be accountable to one another on their progress in the current sprint. Each team member take turns for status reporting — what was done the day before, what to do today, any potential obstacles. The most effective communication happens when DS team members meet face-to-face to share their work.
6. Review the sprint output (sprint retrospective meeting). At the end of two weeks, there should be a functional output for the project team to demonstrate, with an incremental improvement in the product. Data scientists should share the outputs before trying to perfect the processes. Get feedback from client stakeholders and prepare for the next sprint. Regular feedback is a key principle for the Agile way of iterative incremental improvement.
7. Prepare for the next sprint. Identify the tasks that are going on well to keep doing it, and identify those that are impediments to be removed. It is important to understand the fact that unlike software development, DS is more experiment based than task based. DS helps explore data so it should be treated as multiple research experiments. Once again, build and prioritise the backlog so that the next sprint can be carried out, to work on the next improvement areas.
8. Roll out the final product. When all stakeholders agree that no more improvement is needed in the product, it is ready for the final deployment. DS projects follow the “law of diminishing improvement”. For example, if a model has achieved 70% accuracy, the next 5–10% improvement will take a lot more effort than before, and it also depends on the limitations in the data set. Decide in the team whether the efforts are worth the incremental improvement.

Challenges with the client
Besides having adequate communication between the DS team and the client, the client’s expectations have to be managed. All clients generally love the idea that Agile is flexible, and that it grants them more opportunities to change their mind as the project develops. However, they might not realise that such flexibility is also costly in both time and money. Here are some things you should do:
(I) Get the client to understand that flexibility is inevitably expensive. It is like a flexible full-fare economy ticket which allows itinerary change will cost much more than the fixed one. Making changes in decision also means that the client is paying for past wasted time and effort.
(II) Set the client’s expectation to commit time for frequent sprint retrospective meetings (e.g. every two weeks) to evaluate the completed sprints. On top of that, the client representative in each meeting needs to be (empowered by higher management) able to make decisions on product specifications. For Agile to work, the client needs to provide continuous feedback and priority setting to keep the project moving.
(III) Earn the client’s trust that each iteration is done with the best possible efforts to deliver value and improve the product. While holding the decision making power, the client also expects an iteration to have tremendous improvement. Such imbalance in responsibility in the client-vendor relationship should be converted to mutual trust and willingness to experiment together. Agile’s principle in collaboration means it is a team effort in both making decisions and delivering value.

Minimum Viable Product
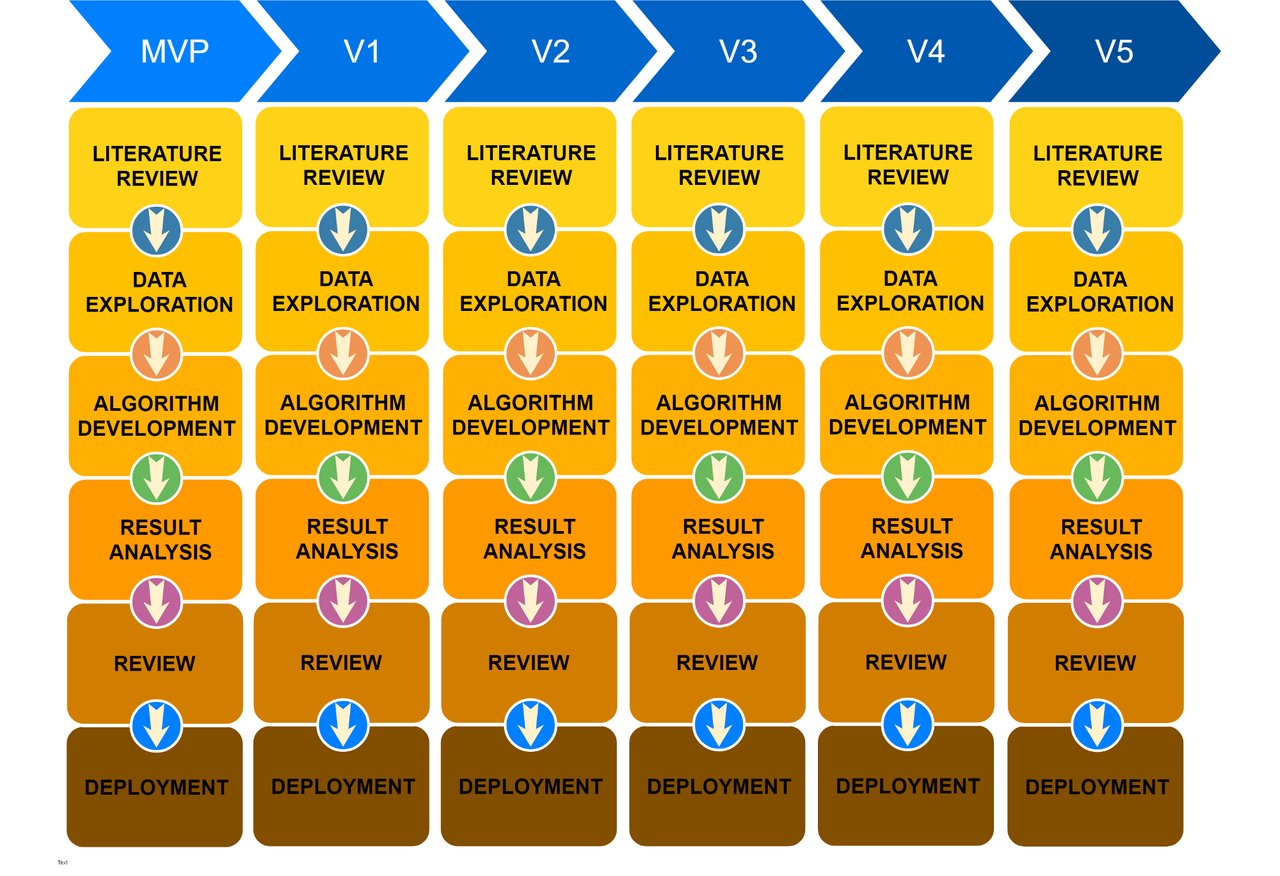
One key feature of the Agile way of working is the development of a minimum viable product (MVP), which is the most fundamental configuration of the product (or tool). After the project objectives have been defined, a proposal is made on the approach to the problem including the MVP to be built within the shortest possible time, e.g. one month for DS projects. The MVP has only the most important functionalities, but its performance may not be the most optimal.
This seems very risky putting a less-than-finished version for the client to test, so the team (including the client) has to be prepared for it. The purpose is to make the MVP work, test it, and see if it is really in the correct direction of solving the problem thus helping the business case. The MVP will grow better, because the DS team is going to use what they have learnt from the MVP feedback to build an improved version. Agile is about continuously deploying and learning from your mistakes, and working with the client to make the product better.
Agile is to plan, build, test, learn, repeat
DS project deliverable
The Agile way of working allows data scientists the ability to prioritize and create roadmaps based on requirements and goals. With each iteration, data scientists can learn something new, get more refined results, and ride on them for the next incremental improvement. Below are some Agile project deliverable to shape and guide project process:
Project vision statement: A summary that articulates the goals for the project.
Project roadmap: The high-level view of the requirements needed to achieve the project vision.
Project backlog: Ordered by priority, this is the full list of what is needed to support your project.
Release plan: A timetable for the release of a working product (or tool), but not documentation. Projects should be self-documenting along the way.
Sprint backlog: The user stories (requirements), goals, and tasks linked to the current sprint.
Increment: The working product functionality that is presented to the stakeholders at the end of the sprint and could potentially be given to the client. The goal is not to deliver more but to get a higher value output.
Summary
Agile is going to be adopted by more DS project teams in the near future. Many data scientists have reported that it makes them more productive. This is not because the data scientists have become more skillful, but because Agile can help them optimize their projects. Instead of spending time on models that are unlikely to reveal any productive results, it is better to spend that time for other result-driven purposes.
Being “agile” (flexible) means you need to adopt a dynamic approach in planning and be adaptable to the changing needs of the new situation when it arises. The Agile environment appeals to quick action, fail quickly, discuss and evaluate, then try again using a different approach or an improved method. It works great in dynamic environments where there is a potential for changing or evolving requirements.
All the best to your DS projects!
Reference:
Data-science? Agile? Cycles? My method for managing data-science projects in the Hi-tech industry.