quintomudigo

Trader, blockchain technologist and contentpreneur

Presearch is a decentralised search engine rewarding its community members for search on several default search sites like its native desearch. Users as well as creators and advertisers can be able to create traffic for their business on the presearch platform by simply staking several keywords related to their business using the presearch token. The more tokens you use to stake for the keyword of your business the more traffic you will bring to your business. The revenue generated on the presearch platform will be shared to its community members taking part in the search activity. Each community member is capable of receiving reward of up to 8 tokens per day upon finishing all their search activity. Towards the end of 2017,presearch conducted their ICO where one coin was going for around $0.02. By the end of the year, the price had managed to go as high as $0.8 but later dropped to around $0.05 in late 2018.In 2019,the price again further dropped to 0.0005. The increase in price has been as a result of the increase in the mass adoption while the decrease in price has been as a result of several users dumping their earned token. The way mass adoption affects the presearch market is further explained as follows;

Mass adoption

There are more than one millionmillion users of presearch. Some are just searchers to earn some bucks on the platform while others are advertisers and online business owners as well as affiliate marketers. An increase in the number of affiliate marketers as well as business owners and advertisers will result to an increase in the utility function of presearch thus resulting to an increase in its price. On the other hand, a decrease will result to a decrease in its utility function thus resulting to a decrease in its price. Therefore, we can further explain the 2021 price analysis for presearch in a bullish and bearish market as follows;

1. Presearch bullish price analysis based on mass adoption

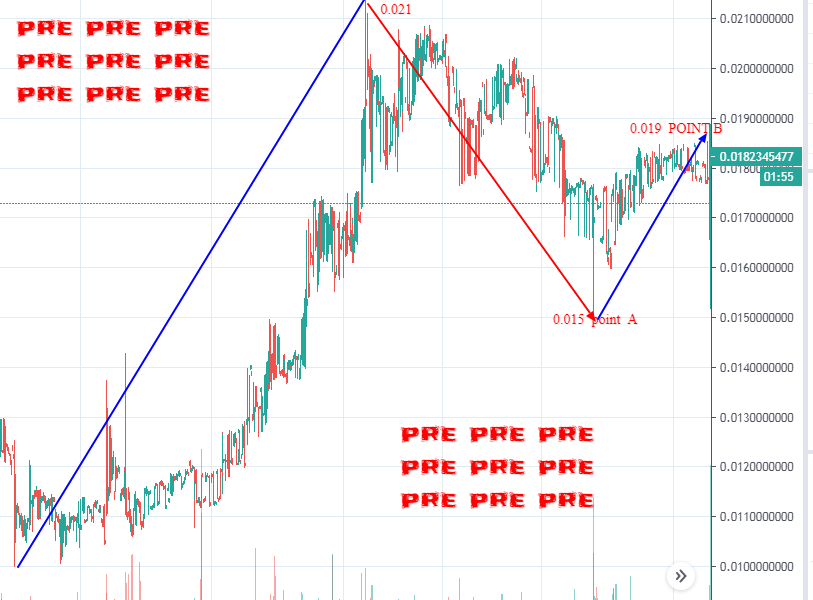
In a bullish market, the presearch will be moving in an upwards direction. In late 2017,the presearch conducted its ICO where one coin was going for around $0.02. The price managed to go as high as $0.8 in early 2018 but later dropped to $0.05 in late the same year. In 2019, the price dropped to around $0.0005. Currently, one presearch is trading at around $0.018 . Here is a view of the chart for presearch;

The above is the presearch market in terms of USDT. Two points are being indicated.There is point A and point B. Before point A, the market for presearch can be seen to be moving upwards all the way to around $0.021 from its low of $0.011. This upwards movement has been as a result of the increase in the number of users on the presearch platform. This result to the increase in the utility function of presearch since online business owners as well as advertisers are starting to purchase the presearch token so that they can use it to stake the keyword related to their business so that to create traffic for their business. At $0.021, the users of the presearch platform have requested to withdraw their token where they dump them in several exchanges. This causes the presearch market to experience an overbought condition thus causing it to resist moving upwards but instead reverse and slightly moves downward to point A at $0.015. At point A, more advertisers as well as business owners are continuing to join the presearch platform so that to create traffic for their business by simply buying the presearch token so that to use it to stake several keywords. This causes the presearch token to have more demand thus causing its price to further increase to point B at around $0.019. By the end of the year, if many businesses as well as advertisers will continue to join the presearch platform, then it will become inefficiency thus causing its demand to increase which may cause the price to go as high as $0.1. This is the right time to buy some presearch token and hold it until it reaches $0.1 so that you sell it to make more profit

2. Presearch bearish price analysis based on mass adoption.

In a bearish market, the presearch will be moving in a downwards direction. In late 2017,the presearch conducted its ICO where one coin was going for around $0.02. The price managed to go as high as $0.8 in early 2018 but later dropped to $0.05 in late the same year. In 2019, the price dropped to around $0.0005. Currently, one presearch is trading at around $0.018 . Here is a view of the chart for presearch;

The above is the presearch market in terms of USDT. Two points are being indicated.There is point A and point B. Before point A, the presearch market can be seen to have been trending in a downwards direction all the way to $0.0105 from its high price of $0.018. This downwards market movement can be as a result of several factors such as strict measures by presearch to users to withdraw their token which result to many users to stop to use the platform .This causes the advertisers as well as online business owners to stop using the coin to buy keywords thus causing the presearch coin to decline its utility function thus causing the price to decrease as stated above.At $0.0105, more users are joining the platform thus luring more advertisers and online business owners to join the presearch platform where they again buy some presearch token in order to use it to stake keywords related to their business. This causes the price to slightly move upwards to point A at $0.015. Some users at presearch platform are starting to feel frustrated because of strict measures to withdraw their tokens thus causing them to stop searching using presearch. This in turn causes the advertisers as well as online business owners to also start exiting the presearch platform since when they advertise there, their keywords will not reach huge users base thus causing the price to decline again to point B at $0.0125 . If this will continue to happen although I am not bearish for presearch, the market for presearch can go as low as below $0.01. I think presearch has a huge potential thus I will not encourage you to sell. Instead, you should buy some presearch token and hold since it is heading upwards.

Summary

Presearch token is a native coin of the presearch platform that is used to reward community members as well as to stake for keywords by advertisers and online business owners. It was created and issued on the ethereum network. Towards the end of 2017 ,presearch conducted its ICO where one coin was going for $0.02. The following year, the price went as high as $0.8 but later dropped to around $0.05 towards the end of the same year. In 2019, presearch experienced a downwards crash where the price went as low as $0.0005. Currently, the price is above $0.01 and it is expected to continue moving upwards to around $0.1. This is the right time to buy and hold since the users base is expected to increase which will as well result to an increase in the number of advertisers as well as online business owners which will cause the utility function of the coin to increase

To receive our post directly to your telegram, then you can join our telegram channel from

below t.me/TeacherForexSchool

You can also join our telegram group to be able to comment on our channel post or support us over there .You can as well share your trading idea and market idea for both fiat and cryptocurrency and be able to be supported by other community member over there on the group with crypto. Here is the link to our telegram group

https://t.me/joinchat/DUNfZg9fTQttyxxGuNKAbg

You are always free to support our work from below;

skrill donation :mudigoomondi@gmail.com

Neteller donation :mudigoomondi@gmail.com

Bitcoin:3AFeiwUp6erj2iRBmdsnc7YhC7gcYVD6oj Ethereum;

0x346570c491b76c7cd51699bdd272762111b743a9 Litecoin: LeEH7B82ccXJ6QoibCryGJNpDGNx2x77fL Dogecoin: DLShs2vqhMc1ggqo8MPPMBTcPAZdqCZoWd lightning network:tipping.me:https://tippin.me/@quintomudigo

Ethereum is a native coin of the ethereum network that was created by vitalik buterin and which can be transfered from one smart contract address to another without involving a third party thus making it to be considered a decentralised asset. Initially, ethereum was using a proof of work consensus but later transformed to a proof of stake consensus in early 2020. On Monday the 18th of May , one ethereum started trading at around $217. By Tuesday the same week, the price had managed to drop to around $209.47 but later rises to 215.77 on Wednesday. . This downwards market movement has been as a result of traders behaviour which can further be explained as follows;

Traders behaviour

Ethereum has a huge community due to several dapps built on its network. This makes it to be able to be traded in an upwards and downwards direction and still makes traders to be able to profit from the market. When the ethereum market is trending upwards, that will be an indication that the sellers are more than the buyers. On the other hand, when the ethereum market is trending downwards, that will be an indication that the buyers are more than the sellers. Since Monday, the market was able to show a possibility of moving downwards which can further be explained as below;

1.Ethereum bearish analysis based on traders behaviour

In a bearish market, ethereum will be moving in a downwards direction. On Monday the 18th of May, one ethereum started trading at around $217. By Tuesday the same week, the price dropped to around $209.47.On wednesday the same week,the price rises again to $215.77 but later dropped to @211.93 the same day. This market movement is being indicated as from the candlestick chart below;

The above is the ethereum market in terms of USDT. Two points are being indicated. There is point A and B. Before point A, the market can be seen to be moving downwards all the way to $209.47 from its previous high of $217. This downward movement has been as a result of the buyers being more than the sellers. This causes the ethereum market to resist moving upwards but instead moves downward to $209.47 as stated above. More traders are starting to sell their ethereum in the hope that the market will continue moving downwards thus causing their ethereum holding to decline in value. This causes the ethereum market to gain an upwards pressure where it slightly moves upward to point A at around $215.77. At point A, more traders again start to buy more ethereum in the hope that the market for ethereum will continue moving upwards thus causing their holding to increase in value. This causes the ethereum market to experience an overbought condition thus causing the market to resist to continue moving upwards but instead reverse and moves downwards to point B at around $211.93. If more buyers will continue buying some ethereum in the hope of the market to continue moving upwards so that they profit, then there is possibility of the market to continue moving downwards all the way to $180. You can sell your ethereum at around $220. and wait to buy it again at around $180. Make sure to apply risk management so that to be safer.

Summary

Ethereum is a native coin of the ethereum network that uses a proof of stake consensus. On the ethereum network, there are so many dapps created there thus making it to be able to have a huge community thus can be tradeable in an upwards and downwards direction. When the ethereum is moving upwards, that will be an indication of an oversold condition while when it is moving downwards, that will be an indication of an overbought condition. Therefore, since the market was able to show a downwards trend on Monday, there is possibility of the market to continue moving downwards all the way to $180 From its previous high of $217. Sell and wait to buy again at $180

To receive our post directly to your telegram, then you can join our telegram channel from

below

t.me/TeacherForexSchool

You can also join our telegram group to be able to comment on our channel post or support us over there .You can as well share your trading idea and market idea for both fiat and cryptocurrency and be able to be supported by other community member over there on the group with crypto. Here is the link to our telegram group

https://t.me/joinchat/DUNfZg9fTQttyxxGuNKAbg

You are always free to support our work from below;

skrill donation :mudigoomondi@gmail.com

Neteller donation :mudigoomondi@gmail.com

Bitcoin:3AFeiwUp6erj2iRBmdsnc7YhC7gcYVD6oj Ethereum;

0x346570c491b76c7cd51699bdd272762111b743a9 Litecoin: LeEH7B82ccXJ6QoibCryGJNpDGNx2x77fL Dogecoin: DLShs2vqhMc1ggqo8MPPMBTcPAZdqCZoWd lightning network:tipping.me:https://tippin.me/@quintomudigo

Trx is a native coin of the trx network that can be transferred from one smart contract address to another without involvement of a third party thus making it a decentralised coin. On the trx network, users as well as developers are able to stake their trx coin to few staking pool thus in return they receive reward in form of new coin minted as well as transaction cost charge thus making it to use a proof of stake consensus. On Monday the 18th of May ,one trx started trading at around $0.01531. By Tuesday the same week, the price had managed to fall to around $0.01431. This downwards trend has been as a result of trx traders behaviour which can further be explained as follows;

Traders behaviour.

TRX has a huge community due to several dapps being built on its network. This makes it to be able to be traded in an upwards and downwards direction and still be able to make traders to profit from doing so. When the trx market is moving upwards, that will be an indication that the sellers are more than the buyers. On the other hand, when the trx market is trending downwards, that will be an indication that the buyers are more that the sellers. Therefore, since the trx market was able to show a bearish trending, the weekly market can further be explained as follows;

1.TRX bearish price analysis based on traders behaviour

In a bearish market, the trx will be moving in a downwards direction. On Monday the 18th of May, one trx started trading at around $0.01555. By Tuesday the same week, the price dropped to around $0.01505.This is indicated as from below;

The above is the trx market in terms of USDT. Two points are being indicated. There is point A and point B . Before point A, the trx market can be seen to be trending in a downwards direction all the way to $0.01505 from its previous high of $0.01555. This downwards trend has been as a result of the sellers being more than buyers. This causes the market to resist moving upwards and gains a downwards movement. At $0.01505, more traders are starting to sell their previously bought trx in the hope that the trx market will continue moving downwards thus causing their holding to decline in value. This causes the market to gain an upwards pressure and moves slightly upwards to point A at $0.01547. More traders are starting to buy some trx at point A in the hope that the market will continue moving upwards thus causing their holding to increase in value. This causes the market to resist moving upwards and reverse where it further moves downwards to point B at around $0.01540. If the buyers will continue being more than sellers, then the trx market will continue moving downwards to around $0.01400. This is the right time to sell if you had previously bought and wait until it reaches $0.01400 so that you purchase

Summary

TRX is a native coin of the trx network created by Justin sun and can be transferred from one tron smart contract address to another without involvement of a third party thus making it a decentralised asset. When the tron market is moving downwards, that will be an indication of an overbought market condition while when it is moving upwards, that will be an indication of an oversold market condition. You can sell your trx at around $0.01531 and wait to buy when the market reaches at around $0.01300

To receive our post directly to your telegram, then you can join our telegram channel from

below t.me/TeacherForexSchool

You can also join our telegram group to be able to comment on our channel post or support us over there .You can as well share your trading idea and market idea for both fiat and cryptocurrency and be able to be supported by other community member over there on the group with crypto. Here is the link to our telegram group

https://t.me/joinchat/DUNfZg9fTQttyxxGuNKAbg

You are always free to support our work from below;

skrill donation :mudigoomondi@gmail.com

Neteller donation :mudigoomondi@gmail.com

Bitcoin:3AFeiwUp6erj2iRBmdsnc7YhC7gcYVD6oj Ethereum;

0x346570c491b76c7cd51699bdd272762111b743a9 Litecoin: LeEH7B82ccXJ6QoibCryGJNpDGNx2x77fL Dogecoin: DLShs2vqhMc1ggqo8MPPMBTcPAZdqCZoWd lightning network:tipping.me:https://tippin.me/@quintomudigo

Neo is a native coin of the neo network that can be transfered from one smart contract address to another without involvement of a third party address thus is being considered to be a decentralized coind.on the neo network, the developers can develop their dapps as well as issue the token of their dapps over there. They can as well use the neo to pay for transaction cost of their dapps using Neo. Developers can also use their Neo coin to vote for validators who will use the coin to secure the neo network as well as to validate transactions taking place on the neo network then in return they receive return in form of new coin minted and transaction cost charged. On Monday, the 4th of may, one neo started trading at around $8.62. By Tuesday the same week, the price had managed to rise to drop to around $9.184. This rise in price has been as a result of traders behaviour which can further be explained as follows;

Traders behaviour

Neo has a huge community of developers who have created several dapps in the neo network thus making it to be well tradeable in an upward and downwards direction. Therefore, we can say that when the neo market is moving upwards, that will be an indication of an oversold market .This will make the neo market to move upwards with few buyers so that it profits with them and makes many sellers to make some losses. On the other hand, when the neo market is moving downwards, that will be an indication of an overbought market .This will make the market to move downwards with few sellers so that it profits with them and makes many buyers to make some losses. Since the market was able to show a bearish conditions, the weekly price analysis for neo based on traders behaviour can be explained as follows;

1.neo weekly bullish price analysis based on traders behaviour

in a bullish market ,the neo will be moving in an upwards market direction. On Monday, the 4th of May, one neo started trading at around $8.62. By Tuesday the same week, the price rises to around $9.184. This rise in price was as a result of an oversold market which is being indicated as from below;

The above is the neo market in terms of USDT . Two points are being indicated. There is point A and point B .Before points A, the market can be seen to be trending upwards all the way to $9.184 from its lower price of $8.621 on Monday. This upward movement has been as a result of the oversold market condition. At $9.184, more buyers started to purchase some NEO in the hope that the market will continue moving upwards. This causes the market to experience an overbought condition thus causing it to resist moving upwards and shortly reverse and moves downwards to point A at $8.845. At point A, more sellers are starting to sell their previously bought NEO in the hope that the market will continue moving downwards thus causing their holding to decline in value. This causes the market to gain an upwards market pressure where it moves upward to point B with few buyers and profits with them at around $9.471. If more sellers will continue to sell their neo, then there is possibility of the neo market to continue moving upwards to around $10.00. On the other hand, if the more traders will continue to buy, then the market will resist moving upwards and starts moving downwards as it is being shown. This is the right time to sell or can wait for $10.00 and sell since the market is almost starting a downwards trend.

summary

NEO uses a delegated proof of stake consensus where users use their neo to vote several validators to run the NEO network as well as to validate any transaction taking place on the NEO network. In return, they earn reward in form of NEO gas. When neo market is moving downwards, that indicates that the volume of buyers are more than those of sellers while when it moves upwards, that indicates that the volume of sellers are more than buyers. The market was able to show an upwards trend since Monday where it has managed to reach around $9.471 from it previous low of 8.621 on Monday. This upward trend can continue until Sunday this week if this will continue. Sell now and wait to buy at around $8.621

To receive our post directly to your telegram, then you can join our telegram channel from

below t.me/TeacherForexSchool

You can also join our telegram group to be able to comment on our channel post or support us over there .You can as well share your trading idea and market idea for both fiat and cryptocurrency and be able to be supported by other community member over there on the group with crypto. Here is the link to our telegram group

https://t.me/joinchat/DUNfZg9fTQttyxxGuNKAbg

You are always free to support our work from below;

skrill donation :mudigoomondi@gmail.com

Neteller donation :mudigoomondi@gmail.com

Bitcoin:3AFeiwUp6erj2iRBmdsnc7YhC7gcYVD6oj Ethereum;

0x346570c491b76c7cd51699bdd272762111b743a9 Litecoin: LeEH7B82ccXJ6QoibCryGJNpDGNx2x77fL Dogecoin: DLShs2vqhMc1ggqo8MPPMBTcPAZdqCZoWd lightning network:tipping.me:https://tippin.me/@quintomudigo

Ontology is a native coin of the ontology network that enables developers to use it to vote for several validators running the network after which they receive reward in form of ontology gas. Developers can also use the ontology gas to create and issue the token of their dapps . Since users of the network can stake the ontology coin to earn reward in form of ontology gas, the ontology network can therefore be considered to be using a delegated proof of stake consensus. On Monday the 27th of April, one ontology started trading at around $0.4978. By Tuesday the same week, the price had managed to fall to $0.4550. This decrease in price has been due to traders behaviour which can further be explained as follows;

Traders behaviour

Ontology has a huge community due to several dapps built on its network. This makes it to be able to be tradeable in an upwards and downwards direction and still be able to profit those traders trading it. When the ontology market is trending in an upwards direction, that will be an indication that the market has previously experienced an oversold condition. This makes it to move upwards with small volume of buyers so that it profits with them and makes large volume of sellers to make some losses. On the other hand, when the ontology market is trending downwards, that will be an indication that the market has experienced an overbought condition. Because of this, the market moves downwards with small volume of sellers so that it profits with them and makes large volume of buyers make some losses. Since the market was able to show a possibility of a bearish market, the weekly price analysis for ontology can further be explained as follows;

1. Weekly ontology bearish price analysis based on traders behaviour

In a bearish market, the ontology

market will be moving in a downwards direction. On Monday the 27th of April, one ontology started trading at around $0.4978. By Tuesday the same week, the price had managed to go as low as $0.4550. This decrease in price has been due to the volume of buyers being more than the volume of sellers. Because of this, the market resist upward movement and gains a downward pressure and moves to $0.4550 as stated . This downward market movement for ontology is being indicated as from the candlesticks chart below;

The above is the ontology market in terms of USDT. Two points are being indicated. There is point A and point B. Before point A, the ontology market can be seen to be moving downwards all the way to $0.4550 from its higher price of $0.4978. This downward movement has been as a result of overbought market condition. This overbought market condition causes the market to gain a downward market pressure all the way to $0.4550 as stated above. At $0.4550, more traders are starting to sell some ontology in the hope that the market will continue moving downwards. This causes the volume of sellers to exceed the volume of buyers thus causing the market to resist to continue moving downwards and reverse to start moving upwards for a shorter period of time to point A at $0.4750. At point A, more traders again start to buy some ontology in the hope that the market will continue moving upwards thus causing their ontology holding to increase in value. This causes the buyers volume to again exceed the volume of ontology sellers thus causing the market gains a downwards pressure and moves downwards to point B at $0.4573. If the buyers will continue exceeding the sellers volume, then there is possibility of the market to continue moving downwards until Sunday where it can reach around $0.4000. This is the right time to sell and wait to buy again some ontology when the price reaches $0.4 since from there it will start moving upwards.

Summary

Ontology uses a delegated proof of stake consensus where users use their ontology to vote several validators to run the ontology network as well as to validate any transaction taking place on the ontology network. In return, they earn reward in form of ontology gas. When ontology market is moving downwards, that indicates that the volume of buyers are more than those of sellers while when it moves upwards, that indicates that the volume of sellers are more than buyers. The market was able to show a downward trend since Monday where it has managed to reach around $0.4550 from it previous high of $0.4978 on Monday. This downward trend can continue until Sunday this week if this will continue. Sell now and wait to buy at around $0.400

To receive our post directly to your telegram, then you can join our telegram channel from

below t.me/TeacherForexSchool

You can also join our telegram group to be able to comment on our channel post or support us over there .You can as well share your trading idea and market idea for both fiat and cryptocurrency and be able to be supported by other community member over there on the group with crypto. Here is the link to our telegram group

https://t.me/joinchat/DUNfZg9fTQttyxxGuNKAbg

You are always free to support our work from below;

skrill donation :mudigoomondi@gmail.com

Neteller donation :mudigoomondi@gmail.com

Bitcoin:3AFeiwUp6erj2iRBmdsnc7YhC7gcYVD6oj Ethereum;

0x346570c491b76c7cd51699bdd272762111b743a9 Litecoin: LeEH7B82ccXJ6QoibCryGJNpDGNx2x77fL Dogecoin: DLShs2vqhMc1ggqo8MPPMBTcPAZdqCZoWd lightning network:tipping.me:https://tippin.me/@quintomudigo

XRP is the native coin of the ripplenet that was created with the main objective of being used by financial institutions to instantly transfer funds between their clients. XRP is not very much decentralized as compared to other cryptocurrencies. On Monday the 13th of April, one XRP started trading at around

$0.17860. By Tuesday the same week, the price rises to around

0.19018 followed by a drop to 0.1818 on Wednesday the same week . On Thursday the same week, the price further dropped to around 0.1900 but later came to rise to to around 0.1939 on Friday. There is possibility of this rise to continue to above 0.2000 by end of the week.This upwards and downwards movement of XRP can further be explained based on traders behaviour as follows;

Traders behaviour

XRP has a huge community of traders due to the usage of its network by several money transfer platforms to instantly process transfer of funds from one user to another. This makes it to be tradeable in an upwards and downwards direction and still be able to profit from the XRP market. Therefore, when the XRP market is trending in an upwards direction, that will be an indication that the number of sellers are more than the number of buyers. This makes it moves upward with few buyers so that it profits with them and makes many sellers make some losses. On the other hand, when the XRP market is trending downwards, that will be an indication that the number of buyers are more than the number of sellers. This makes the XRP market to resist moving upwards and moves downward with few sellers so that it profits with them and makes many buyers make some losses. Since the XRP market was able to show a possibility of moving upwards on Monday, we can therefore explain its bullish weekly price analysis as follows;

1. Weekly XRP bullish price analysis based on traders behaviour

In a bullish market, the XRP will be moving in an upwards direction. On Monday the 13th of April, one XRP started trading at around $0.17860. By Tuesday the same week, the price had gone to around $0.190180 followed bya drop to around 0.18180 on Wednesday the same week. On Thursday the same week, the price further dropped to around 0.17560 but later rises to around

0.1970 on Friday the same week. This price movement for XRP is being indicated as from the candlesticks chart below;

The above is the XRP market in terms of USDT. From the market, two points are being indicated. There is point A and point B. Before point A, the market has been moving in an upwards direction all the way to around $0.1940. At 0.1940, more traders have started purchasing some given amount of XRP in the hope that the XRP market will continue moving upwards. This causes the XRP market to experience an overbought market condition. Because of this overbought condition, the XRP market resist moving upwards and reverse where it slightly moves downwards to point A at around

$0.1860. At point A, the traders who had previously purchased their XRP and are still holding them start to sell them in the hope that the market will fall down further thus causing their holding for XRP to decline in value. This cause the XRP market to experience some oversold condition where it gains an upward market pressure and moves upward to point B at around $0.188850.

By Sunday of this week, if more XRP holders will continue selling their XRP, then there is possibility of the market to further continue moving upwards. The market can move as high as $0.2100 if this will continue. This is the right time to buy some XRP at current market price of around $0.1860 and hold it until it reaches around $0.2100 so that you make some huge profit. Make sure to apply risk management when you purchase some XRP so that whenever the market goes against you, you don't make some huge losses.

Summary

XRP is a native coin of the ripplenet network that enables online money transfer platforms to be able to instantly transfer money from one user to another. This makes it to have a huger community thus can easily be tradeable in an upward and downwards direction and still makes traders to be profitable. When the market is trending upwards, that will be an indication of an oversold condition while when the market is trending downwards, that will be an indication of an overbought market condition. The market has been trending upwards since Monday and has managed to reach $0.1940 from its lowest on Monday at around

$0.17860. Continue holding until it reaches $0.2100 so that you make more profit

To receive our post directly to your telegram, then you can join our telegram channel from

below t.me/TeacherForexSchool

You can also join our telegram group to be able to comment on our channel post or support us over there .You can as well share your trading idea and market idea for both fiat and cryptocurrency and be able to be supported by other community member over there on the group with crypto. Here is the link to our telegram group

https://t.me/joinchat/DUNfZg9fTQttyxxGuNKAbg

You are always free to support our work from below;

skrill donation :mudigoomondi@gmail.com

Neteller donation :mudigoomondi@gmail.com

Bitcoin:3AFeiwUp6erj2iRBmdsnc7YhC7gcYVD6oj Ethereum;

0x346570c491b76c7cd51699bdd272762111b743a9 Litecoin: LeEH7B82ccXJ6QoibCryGJNpDGNx2x77fL Dogecoin: DLShs2vqhMc1ggqo8MPPMBTcPAZdqCZoWd lightning network:tipping.me:https://tippin.me/@quintomu

BAT is a native coin of the brave platform that rewards creators for distributing their content as well as users for accessing creators contents via brave platform. BAT token is being issued and created on the ethereum network thus one user can be able to transfer their brave token from one ethereum smart contract address to another without involvement of a third party thus making it a decentralized cryptocurrency. The validators running the ethereum network are the one who will initiate the transaction to the second smart contract address upon the first smart contract address to have paid the gas fees. On Monday the 13th of April, one BAT started trading at around

$0.1540. By Tuesday the same week, one BAT had gone as high as $0.1610. This increase in price has been due to the BAT market to have experienced an oversold condition. This causes the market to gain an upward market direction. This can further be explained as below based on traders behaviour

Traders behaviour

BAT has a huge community of creators. Each creator has managed to entice the community of his content to join the brave platform so that they can support their channel or website. This makes the BAT coin to have a huge buyers and sellers thus causing it to be able to be traded in an upward and downwards direction where traders can still profit from the BAT market. Therefore, we can say that when the BAT market is trending in an upwards direction, that will be an indication that the market is in an oversold condition. This will make the BAT market to gain an upwards pressure where it will move upwards with few buyers so that it can profit with them and makes many sellers make some losses. On the other hand,when the BAT market is trending downwards, that will be an indication that the market is in an overbought condition. Because of this, the market

moves downwards with few sellers so that it profits with them and makes many buyers make some losses. Since the BAT market was able to show a possibility of bullish market on Monday and Tuesday, the weekly bullish market for BAT can further be explained as follows;

1. Weekly BAT bullish price analysis based on traders behaviour

In a bullish market, the BAT will be moving in an upwards direction. On Monday the 13th of April 2020, one BAT started trading at around $ 0.1540. By Tuesday the same week, the price rises all the way to around

0.1610. This increase in price has been due to the number of BAT sellers being more than buyers and is being illustrated as from the candlesticks chart below;

The above is the BAT market in terms of USDT. From the market above, two points are being indicated. There is point A and point B. Before point A, the BAT market can be seen to be moving in an upwards direction all the way to 0.1610. This upward movement has been as a result of an oversold market condition for BAT which causes the BAT market to gain an upward market pressure and moves upward to

0.1610 as stated earlier. At 0.1610, More traders started to purchase some BAT in the hope that the market will continue moving upwards. This cause the market to experience an overbought condition thus causing the BAT market to resist moving upwards and reverse in a downwards direction all the way to point A at 0.1575. At point A, more sellers started to sell their BAT holding in the hope that the BAT market will continue moving downwards thus causing their holding to decline in value. This causes the BAT market to experience an oversold condition where it again gains an upward market pressure and moves upward to above 0.16051. If this might continue, then the market can afford to reach $0.20000 by the end of this week. If you had previously purchased your BAT and your are still holding, then you can continue holding until it reaches $0.2 so that you sell to make some profit.

Summary

BAT is a native coin of the brave platform created and issued on the ethereum network which is used to reward creators for sharing their work to their community as well as users for viewing ads while watching creators work. There is possibility of the BAT to be moving upwards the whole week after it started trading at around $0.1540 on Monday but rises on Tuesday to around $0.1610. Therefore, we can say that when BAT is in an oversold market condition, that will be an indication that the sellers are more than buyers thus the market will be moving upwards while when the BAT market is in an overbought condition, that will be an indication that the buyers are more than the sellers thus the market will be moving downwards . This is the right time to buy some BAT at current price of around $0.158 and holds it until it reaches around $0.2 by Sunday.

To receive our post directly to your telegram, then you can join our telegram channel from

below t.me/TeacherForexSchool

You can also join our telegram group to be able to comment on our channel post or support us over there .You can as well share your trading idea and market idea for both fiat and cryptocurrency and be able to be supported by other community member over there on the group with crypto. Here is the link to our telegram group

https://t.me/joinchat/DUNfZg9fTQttyxxGuNKAbg

You are always free to support our work from below;

skrill donation :mudigoomondi@gmail.com

Neteller donation :mudigoomondi@gmail.com

Bitcoin:3AFeiwUp6erj2iRBmdsnc7YhC7gcYVD6oj Ethereum;

0x346570c491b76c7cd51699bdd272762111b743a9 Litecoin: LeEH7B82ccXJ6QoibCryGJNpDGNx2x77fL Dogecoin: DLShs2vqhMc1ggqo8MPPMBTcPAZdqCZoWd lightning network:tipping.me:https://tippin.me/@quintomu

Dogecoin is a native coin of the dogechain network that can be transfered from one dogecoin peer address to another without a third party involvement. This makes it a decentralized asset. Dogecoin uses a proof of work consensus thus miners share their computing power to be used to secure the dogechain network and to validate transaction taking place on the dogechain network thus in return they receive a reward in form of new dogecoin mined as well as fees charged in initiating the transaction to the second dogecoin peer address. On Monday the 6th of April, one dogecoin started trading at around $0.001854. By Tuesday the same week, the price had managed to go as high as $0.002015 Followed by another increase of $0.002040

on Wednesday. On Thursday the same week, the price slightly dropped to around $0.001988

But rises to around $0.002011 on Thursday the same week. This increase in price has been as a result of traders behaviour in market for dogecoin which can be explained as below

Traders behaviour

Although no dapps can be built on dogechain network, dogecoin still has a huge community due to its tipping role in several social media platform. Because of this, it can easily be tradeable in an upward and downward direction and still makes traders profit from it. When the dogecoin market is moving in an upwards direction, that will be an indication that the dogecoin market has previously been oversold thus the market gains an upward direction with few buyers where it profits with them. On the other hand, when the dogecoin market is trending downwards, that will be an indication that there has been an overbought market previously thus causing the dogecoin market to resist moving upwards and reverse to a downwards market direction with few sellers so that it profits with them. Since the beginning of Monday, dogecoin was able to show a possibility of bullish market which can still continue until the end of the week. This bullish market for dogecoin can further be explained on a weekly basis as follows;

1. Weekly dogecoin bullish price analysis based on traders behaviour

In a bullish market, the dogecoin market normally will be moving in an upwards direction. On Monday the 6th of April, one dogecoin started trading at around $0.001854. The price rises to around

$0.002015 on Tuesday the same week which was followed by another rise to

$0.002040 on Wednesday the same week. On Thursday the same week, the price slightly falls to $0.001988 by later rises to $0.002020 on Thursday the same week. This price movement for dogecoin is being indicated as from the csndlesticks chart below;

The above is the dogecoin market in terms of USDT. Two points are being indicated . There is point A and point B. Before point A, the dogecoin market can be seen to be moving in an upwards market direction all the way to around

$0.002020. This upward market movement for dogecoin is as a result of the number of sellers being more than the number of buyers. Because of this, the dogecoin market gains an upward market pressure where it moves upward with few number of buyers to $0.002020 as indicated earlier. At $0.002020, more buyers continue to purchase a given amount of dogecoin with their USDT balance in the hope that the dogecoin market will continue moving upwards . This result to the number of buyers exceeding the number of dogecoin sellers thus causing the dogecoin market to resist to continue moving upwards and instead reverse and starts moving downwards to point A at around $0.001960. At point A, more traders holding dogecoin begin to sell their dogecoin in the fear that the market will continue moving downwards thus causing their dogecoin holding to decline in value. This causes the dogecoin market to gain an upward market pressure and moves upward to point B at around $0.002000. There is possibility of the market to reach above $0.002200 by Sunday if the sellers will continue to exceed the buyers. If you had previously purchased your dogecoin and you are still holding, then you can continue holding until the price reaches $0.002200 or you can sell at around $0.002000 since the market will start moving downwards from there.

Summary

Dogecoin uses a proof of work consensus and is based on dogechain network. Miners of dogecoin are rewarded for sharing their computing power to be used to secure the dogechain network and to validate transaction taking place on the dogechain network. Since Monday this week, dogecoin has managed to rise from $0.001854 all the way to around $0.002040 by Thursday due to the number of sellers exceeding the number of dogecoin buyers. Therefore, we can say that when the dogecoin buyers are more than sellers, the dogecoin market will be moving in a downwards direction while when the dogecoin sellers are more than buyers, then the dogecoin market will be moving in an upwards market direction.

To receive our post directly to your telegram, then you can join our telegram channel from

below t.me/TeacherForexSchool

You can also join our telegram group to be able to comment on our channel post or support us over there .You can as well share your trading idea and market idea for both fiat and cryptocurrency and be able to be supported by other community member over there on the group with crypto. Here is the link to our telegram group

https://t.me/joinchat/DUNfZg9fTQttyxxGuNKAbg

You are always free to support our work from below;

skrill donation :mudigoomondi@gmail.com

Neteller donation :mudigoomondi@gmail.com

Bitcoin:3AFeiwUp6erj2iRBmdsnc7YhC7gcYVD6oj Ethereum;

0x346570c491b76c7cd51699bdd272762111b743a9 Litecoin: LeEH7B82ccXJ6QoibCryGJNpDGNx2x77fL Dogecoin: DLShs2vqhMc1ggqo8MPPMBTcPAZdqCZoWd lightning network:tipping.me:https://tippin.me/@quintomu

Bitcoin cash is a native coin of the Bitcoin cash network that came to be as a result of the Bitcoin hard-fork and whose transaction can take place from one smart contract address to another without involvement of a third party . On Bitcoin cash network which uses a proof of work consensus, different dapps can be built over there with the Bitcoin cash coin being used to pay for transaction costs of those dapps as well as to create and issue the tokens of those dapps on the Bitcoin cash network. On Monday the 6th of April, one Bitcoin cash started trading at around USD$236. By Tuesday the same week, the price had managed to go as high as $262 but slightly dropped to $246 on Wednesday. The same Wednesday, the price again rises to $277. This increase in price has been due to the number of Bitcoin cash sellers being more than Bitcoin cash buyers. This traders behaviour in market for Bitcoin cash can further be explained as follows;

Traders behaviour

Having gone through the hard-fork from Bitcoin, Bitcoin cash was able to have huge community members. Because of this, it can easily be traded in an upwards and downwards direction. Therefore, we can say that when the Bitcoin cash is moving upwards, that will be an indication that sellers are more than buyers while when the market is moving downwards, that will be an indication that the buyers are more than sellers. Furthermore, since the Bitcoin cash market was able to show a possibility of bullish movement on Monday, we can therefore explain its weekly bullish market behaviour based on traders behaviour as follows;

1.Weekly Bitcoin cash price analysis based on traders behaviour

In a bullish market, the Bitcoin cash will be moving in an upwards direction. On Monday the 6th of April , the Bitcoin cash market was able to show the possibility of moving upwards where it started trading at around $236. By Tuesday the same week, the price had managed to go as high as $262 followed by another rise of $277 on Wednesday . This increase in price has been as a result of the number of sellers being more than buyers thus causing the market to gain an upward market pressure. This is indicated as from the candlesticks chart below;

The above is the Bitcoin cash market. From the market, two points are being indicated. There is point A and point B. Before point A, the Bitcoin cash market can be seen to be trending upwards all the way to $277. This upward trend has been as a result of the number of sellers being more than buyers thus causing the market to gain an upward market pressure and moves to $277 as stated earlier. At $277, more buyers started purchasing Bitcoin cash in the hope that the market will continue moving upwards. This result to the number of buyers exceeding the number of sellers thus causing the market to shortly resist to continue moving upwards and reverse and starts moving downwards to point A at around $257. At point A, more sellers again start to sell their Bitcoin cash in the hope that the market will continue the downwards trend thus resulting to a decline on the valuation of their Bitcoin cash holding. This causes the number of Bitcoin cash selling it to exceed those buying it thus causing the market to gain an upward pressure support and moves upward to point B at above $270. If sellers will continue exceeding buyers, then the market can continue moving upwards until the end of this week. The market can go as high as $280 or $300 after which it will reverse and starts moving downwards. This is the right time to buy a given amount of Bitcoin cash at current price of around $260 and holds it until it reaches around $280 so that you sell and easily make your profit. If you had previously purchased some bitcoin cash then you can still continue holding it so that you sell at higher price of above $280

Summary

Bitcoin cash came to be as a result of Bitcoin hard-fork. Developers can develop their dapps on the Bitcoin cash network where they can also use the Bitcoin cash to create and issue the token of their dapps. Since traders are the one causing the market behaviour, we can therefore say that when the Bitcoin cash is moving upwards, that will be an indication that there is oversold market while when the Bitcoin cash is moving downwards, that will be an indication that the market is in an overbought condition. Since Monday this week, the Bitcoin cash shows the possibility of upward trend. This is the right time to buy at current market price of around $260 and hold it until it reaches $280 .Make sure to apply risk management whenever to purchase some Bitcoin cash so that whenever the market goes against you, your holding don't devalue so much.

To receive our post directly to your telegram, then you can join our telegram channel from below

t.me/TeacherForexSchool

You can also join our telegram group to be able to comment on our channel post or support us over there .You can as well share your trading idea and market idea for both fiat and cryptocurrency and be able to be supported by other community member over there on the group with crypto. Here is the link to our telegram group

https://t.me/joinchat/DUNfZg9fTQttyxxGuNKAbg

You are always free to support our work from below;

skrill donation :mudigoomondi@gmail.com

Neteller donation :mudigoomondi@gmail.com

Bitcoin:3AFeiwUp6erj2iRBmdsnc7YhC7gcYVD6oj

Ethereum; 0x346570c491b76c7cd51699bdd272762111b743a9

Litecoin: LeEH7B82ccXJ6QoibCryGJNpDGNx2x77fL

Dogecoin: DLShs2vqhMc1ggqo8MPPMBTcPAZdqCZoWd

lightning network:tipping.me:https://tippin.me/@quintomudigo

XRPtIPBOT: in all platform: username is: quintomudigo

Ethereum is a native coin of the ethereum network that can be transfered from one smart contract address to another without involving a third party. This makes it to be considered as a decentralized asset. Ethereum network enables developers to build their dapps over there as well as to create and issue the tokens of their dapps. It also enables ethereum holders to be able to lease their ether coin to staking pool and be able to earn rewards when their ether is used to validate transactions on the ethereum network as well as to secure the ethereum network. On Monday the 30th of March, one ethereum started trading at around   $131. By Tuesday the same week, the price had managed to rise to around $135 but later came to drop to $133 on Wednesday. On Thursday the same week, the price rose again to around $136 followed by another rise of $148 on Friday. This upwards and downwards movement of ethereum has been due to traders behaviour which can be explained as follows;

Traders behaviour

Ethereum has many dapps built on its network. This makes ethereum to be well tradeable due to its high utility power. Therefore, traders can profit in both upwards and downwards direction on this coin. We can therefore say that when the ethereum market is moving upwards, that will be an indication that there are excess sellers than buyers while when the ethereum market is moving downwards ,the number of buyers will be more than the number of sellers. Since ethereum has shown a possibility of a bullish market since Monday, we can therefore further explain its weekly bullish price analysis as from below;

1. Weekly ethereum bullish price analysis based on traders behaviour

In a bullish market,ethereum will be moving in an upwards direction. On Monday the 30th of March, one ethereum started trading at around $131 . By Tuesday, the price rose to $135 but later dropped to around $133 on Wednesday. By Thursday the same week, the price rises again to $136 followed by another rise to $148 on Friday. This weekly ethereum price movement is being indicated as from the candlesticks chart below;

The above is the ethereum market in terms of USDT. Two points are being indicated. There is point A and point B. Before point A, the ethereum can be seen to be moving in an upwards direction all the way to around $148. This upward market movement has been as a result of the number of ethereum sellers being more than ethereum buyers. This makes the ethereum market to gain an upward market pressure to $148 as stated earlier. At $148, more number of buyers start to buy a given amount of ethereum in the hope that ethereum will continue moving upwards. This causes the buyers to exceed the sellers thus causing the market to resist to continue moving upwards and instead reverse and shortly moves downwards to point A at around 

$138. At point A, more sellers start to sell their previously purchased ethereum fearing that the market will continue moving downwards thus causing their holding in ether do decline in value. This causes the number of sellers to exceed the number of buyers thus causing the ethereum to again gain an upward market pressure and moves to point B at around $142. If the sellers will continue to be more than the buyers, then there is possibility of the ethereum to continue moving upwards until Monday next week. If this will happen, then ethereum can go as high as $160 next week. This is the right time to buy ethereum and hold until next week at around $160. Can purchase at current market price of around $137. Make your purchase using risk management so that when the market goes against you, you don't lose your valuation.

Summary

Ethereum is a proof of stake coin based on ethereum network where developers can use it to pay for their dapps as well as for transaction cost on the ethereum network. This makes it to have a huge community thus well tradeable. In an upward market, that signals the trader that sellers are more than buyers and vice versa. There is possibility of the ether market to go as high as $160 next week. This is the right time to buy at around $135 and hold

To receive our post directly to your telegram, then you can join our telegram channel from below

t.me/TeacherForexSchool 

 You can also join our telegram group to be able to comment on our channel post or support us over there .You can as well share your trading idea and market idea for both fiat and cryptocurrency and be able to be supported by other community member over there on the group with crypto. Here is the link to our telegram group

https://t.me/joinchat/DUNfZg9fTQttyxxGuNKAbg

You are always free to support our work from below;

skrill donation :mudigoomondi@gmail.com

Neteller donation :mudigoomondi@gmail.com

Bitcoin:3AFeiwUp6erj2iRBmdsnc7YhC7gcYVD6oj

Ethereum; 0x346570c491b76c7cd51699bdd272762111b743a9

Litecoin: LeEH7B82ccXJ6QoibCryGJNpDGNx2x77fL

Dogecoin: DLShs2vqhMc1ggqo8MPPMBTcPAZdqCZoWd

lightning network:tipping.me:https://tippin.me/@quintomudigo

  XRPtIPBOT: in all platform: username is: quintomudigo