Trading cryptocurrency market using Donchian channels indicator

Donchian channels is a trend following indicator.
As a trend following ,Donchian channels was created by Richard Donchian to help traders to know the direction of the market by identifying the volatility of the market.
Just like in bollinger band,donchian channels also has 3 bands, the upper band, the lower band and the middle band.The upper band represents the highest high price over a given n period while the lower band represents the lowest low price over a given n period.The middle band represents the average of the upper and lower band and is used to identify the price breakout.
Donchian channels is therefore calculated using the following formula;
middle band\=(upper band + lower band)/2
upper band\= highest high over a given n period
lower band = lowest low over a given n period
Therefore, the bullish and bearish cryptocurrency market using donchian channels is therefore explained as follows;
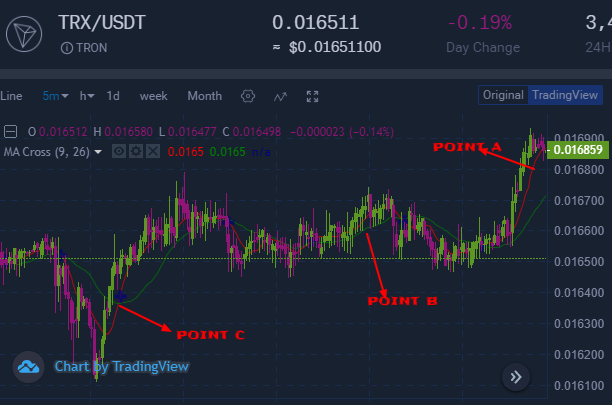
1.Donchian channels bullish cryptocurrency market
Since donchian channel is a trend following indicator and it has 3 bands, upper band, middle band and lower band, it therefore follows that when the price rises above the upper band that will be an indication of an upward market movement thus the trader should be trading in an upward market direction.If the price falls below the lowest low point of lower band, that will be an indication of an oversold market thus the cryptocurrency trader should purchase a given amount of cryptocurrency since the market will start moving upwards. The trader can either place a market buy order which will be processed immediately or they can place a limit buy order which will be processed when the market reaches a limit buy order price. This is indicated as from below;
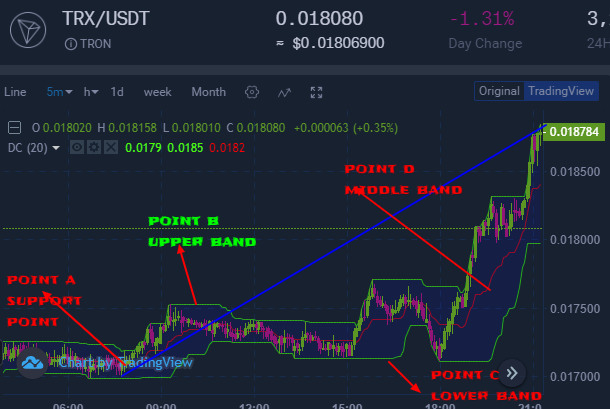
The above represents the TRX market against USDT. 4 points are being indicated. There is point A , Point B, Point C and Point D . Point B is the upper band, point C is the lower band while point D is the middle band. On the other hand, point A is the support point. At point A, the price has fallen below the lowest low point of the lower band thus an indication of a support point over there. This signals the cryptocurrency trader to purchase a given amount of TRX since the market has gained support over there and will start moving upwards.The trader can either place a market buy order which will be processed immediately or they can place a limit buy order which will be processed when the market reaches a buy limit order price. When the order is being processed, the account of the trader will start increasing in value in terms of USDT.
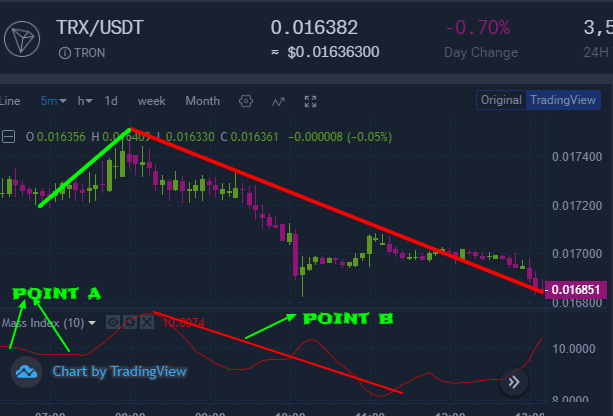
2.Donchian channels bearish cryptocurrency market
Since donchian channel is a trend following indicator and it has 3 bands, upper band, middle band and lower band, it therefore follows that when the price falls below the lower band that will be an indication of a downward market movement thus the trader should be trading in a downward market direction.If the price rises above the highest high point of upper band, that will be an indication of an overbought market thus the cryptocurrency trader should sell a given amount of cryptocurrency which he had previously purchased and is currently holding to avoid decreasing the value of his trading account. The trader can either place a market sell order which will be processed immediately or he can place a limit sell order which will be processed when the market reaches his limit sell order price. This is indicated as from below;

The above represents the TRX market against USDT. 4 points are being indicated. There is point A , Point B, Point C and Point D . Point B is the upper band, point C is the lower band while point D is the middle band. On the other hand, point A is the support point. At point A, the price has risen above the highest high point of the upper band thus an indication of a resistance point over there. This signals the cryptocurrency trader to sell a given amount of TRX which he had previously purchased and is currently holding to avoid decreasing the value of the account since the market is starting to move downwards. The trader can either place a market sell order which will be processed immediately or he can place a limit sell order which will be processed when the market reaches his sell limit order price. When the order is being processed, the account of the trader will have increased in value in terms of USDT.
cryptocurrency market is a highly volatile market. As a cryptocurrency trader,whenever you place a buy order,always make sure to apply risk management so that whenever your buy order goes against you, your account do not depreciate so much in value.
To receive our post directly to your telegram, then you can join our telegram channel from below
t.me/TeacherForexSchool
You can also join our telegram group to be able to comment on our channel post or support us over there .You can as well share your trading idea and market idea for both fiat and cryptocurrency and be able to be supported by other community member over there on the group with crypto. Here is the link to our telegram group
https://t.me/joinchat/DUNfZg9fTQttyxxGuNKAbg
You are always free to support our work from below;
skrill donation :mudigoomondi@gmail.com
Neteller donation :mudigoomondi@gmail.com
Bitcoin:3AFeiwUp6erj2iRBmdsnc7YhC7gcYVD6oj
Ethereum; 0x346570c491b76c7cd51699bdd272762111b743a9
Litecoin: LeEH7B82ccXJ6QoibCryGJNpDGNx2x77fL
Dogecoin: DLShs2vqhMc1ggqo8MPPMBTcPAZdqCZoWd
lightning network:tipping.me:https://tippin.me/@quintomudigo
XRPtIPBOT: in all platform: username is: quintomudigo