Racket Plot: Energy and Population with Rectangles
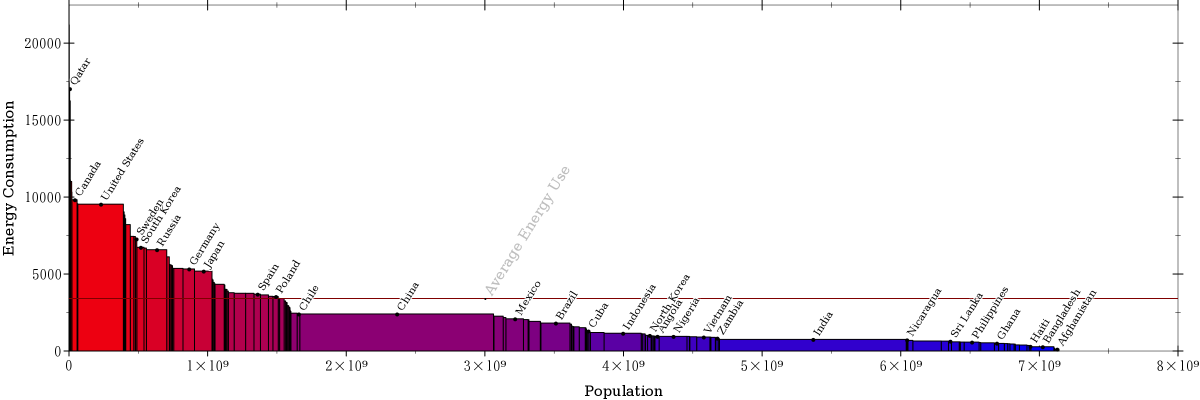
A previous script uses lines-interval plots (fn:1) to visualize data for energy use and population. Plotting with rectangles is more direct for this type of visualization. Accumulating population numbers gives a feel unequal distribution of energy, a lot more people live in countries below the mean than above the mean.
With more time to play with these visualizations I'd like to see if it's easier to label more countries on the plot that accumulates population along the y-axis.

Here's proof that the code for this plot worked in DrRacket:

Accumulating data along the y axis might be better for views on hand-held screens. People tend to hold their phones up so that the y-axis is longer than the x-axis.
Maybe next week I'll print out both versions and see which once is a better help for thinking, “analytical reasoning”(Edward Tufte?).

I made the line-colors darker, hoping it would give a sense for where a lot of different less-populous countries are bunched together. One day I will label all the countries and play with DrRacket: zooming in on the dark areas representing many countries.
With the right focus Racket seems to make anything possible when you get the desire for data-shaping and plot-creation. Now I want to find worthwhile data to work with.
code
#lang racket

;; for DrRacket use:
(current-directory-for-user "/home/brian/Racket/Earth-Data/")
(define Energy-Data-File "EnergyConsumption2003W.csv")
(define Population-File "Population2019.csv")

(define get-path
  (lambda (file-name)
    (build-path (current-directory-for-user) file-name)))

(define get-data
  (lambda (pth)
    (let* ((inp (open-input-file pth))
	   (lines (port->lines inp)))
      (close-input-port inp)
      (map (lambda (s) (string-split
			(regexp-replace* "\"" s "")
				     ","))
	   lines))))

(define csvf->dict
  (lambda (file-name)
    (get-data (get-path file-name))))

(define EnergyDict (csvf->dict Energy-Data-File))
(define PopulationDict (csvf->dict Population-File))

(require racket/dict)

(define ref-str->num
  (lambda (dct)
    (map (lambda (l) (list (first l)
			   (string->number (second l))))
	 dct)))

(define ref-str->sym
  (lambda (dct key)
    (string->symbol (car (dict-ref dct key)))))

(define PopNums (ref-str->num (cdr PopulationDict)))
(define EnergyNums (ref-str->num (cdr EnergyDict)))

(define ref-sort
  (lambda (dct)
    (sort dct #:key second >)))

(define OrdrdEnergyNumsDict
  (ref-sort EnergyNums))

(define shared-key-combined-refs
  (lambda (d1 d2)
    (let ((cmbnd '()))
      (dict-for-each d1
		     (lambda (k v)
		     (when (dict-has-key? d2 k)
		       (set! cmbnd (cons (list k
					    (car (dict-ref d1 k))
					    (car (dict-ref d2 k)))
				      cmbnd)))))
      (reverse cmbnd))))

(define Combined-EnePop-EneOrder
  (shared-key-combined-refs OrdrdEnergyNumsDict PopNums))

(require plot)
(require plot/utils)

(define rect-xs-y
  (lambda (x1 x2 y clr)
    (rectangles (list
		 (vector (ivl x1 x2)(ivl 0 y)))
		#:color clr #:line-color "black")))

(define rectangles-accumulated-x
  (lambda (xs ys)
    (let ((rct-clrz (color-seq "red" "blue" (length xs))))
	(define helper
	  (lambda (x-accum xvals yvals clrz rcts)
	    (let ((x (+ x-accum (car xvals)))
		  (y (car yvals))
		  (clr (car clrz)))
	      (cond
	       ((empty? (cdr xvals)) (cons (rect-xs-y x-accum x y clr) rcts))
	       (#t (helper x (cdr xvals) (cdr yvals) (cdr clrz)
			   (cons (rect-xs-y x-accum x y clr) rcts)))))))
	(helper 0 xs ys rct-clrz '()))))


(require (only-in math/statistics mean))

(define mean-energy (mean
                     (map second Combined-EnePop-EneOrder)))

(define get-country-pop-half-label-point
  (lambda (k)
    (let* ((k-pop (second (dict-ref Combined-EnePop-EneOrder k)))
	   (k-pop-half (* .5 k-pop)))
      (define helper
	(lambda (accu-pop dct)
	  (cond
	   ((empty? dct) 0)
	   ((equal? k (first (car dct))) (+ accu-pop k-pop-half))
	   (#t (helper (+ accu-pop (second (cdar dct))) (cdr dct))))))
      (helper 0 Combined-EnePop-EneOrder))))

(define pop-bar-label
  (lambda (k)
    (let* ((x (get-country-pop-half-label-point k))
	   (y (first (dict-ref Combined-EnePop-EneOrder k))))
      (point-label (vector x y)
		   k
		   #:anchor 'left
                   #:size 8
		   #:angle 45))))


(define label-countries (list
"Afghanistan" "Angola" "Bangladesh" "Brazil" "Canada" "Chile" "China" "Cuba" "Germany" "Ghana" "Haiti" "India" "Indonesia" "Japan" "Mexico" "Nicaragua" "Nigeria" "North Korea" "Philippines" "Poland" "Qatar" "Russia" "South Korea" "Spain" "Sri Lanka" "Sweden" "United States" "Vietnam" "Zambia"))

(parameterize ((plot-x-ticks (linear-ticks #:number 6)))
    (plot (list
           (rectangles-accumulated-x (map third Combined-EnePop-EneOrder)
				     (map second Combined-EnePop-EneOrder))
           (hrule mean-energy)
           (point-label (vector (* 3 (expt 10 9)) mean-energy)
                       "Average Energy Use"
                       #:color "gray"
                       #:anchor 'left
                       #:angle 45
                       #:point-size 2)
           (point-label (vector (* 3 (expt 10 9))  21500)
			"https://en.wikipedia.org/wiki/List_of_countries_by_energy_consumption_per_capita"
                        #:color "gray" #:point-size 0)
           (point-label (vector (* 3 (expt 10 9))  20500)
			"https://en.wikipedia.org/wiki/List_of_countries_and_dependencies_by_population"
                        #:color "gray" #:point-size 0)
           (map pop-bar-label label-countries)
           )
     #:width 1200
     #:x-label "Population"
     #:y-label "Energy Consumption"
     #:x-max  (* 7.5 (expt 10 9))
     #:out-file "Population-EnergyConsumption-DrRacket-1.png"
     #:out-kind 'png
     ))

(define rect-x-ys
  (lambda (x y1 y2 clr)
    (rectangles (list
		 (vector (ivl 0 x)
			 (ivl y1 y2)))
		#:color clr #:line-color "black")))

(define rectangles-accumulated-y
  (lambda (xs ys)
    (let ((rct-clrz (color-seq "red" "blue" (length xs))))
      (define helper
	(lambda (xvals yvals y-accum clrz rcts)
	  (let ((y (+ y-accum (car yvals)))
		(x (car xvals))
		(clr (car clrz)))
	    (cond
	     ((empty? (cdr yvals)) (cons (rect-x-ys x y-accum y clr) rcts))
	     (#t (helper (cdr xvals) (cdr yvals) y (cdr clrz)
			 (cons (rect-x-ys x y-accum y clr) rcts)))))))
      (helper xs ys 0 rct-clrz '()))))

(define pop-bar-label-y
  (lambda (k)
    (let* ((y (get-country-pop-half-label-point k))
	   (x (first (dict-ref Combined-EnePop-EneOrder k))))
      (point-label (vector x y)
		   k
		   #:anchor 'bottom-left
                   #:size 8
		   ;;#:angle 45
                   ))))

(parameterize ((plot-y-ticks (linear-ticks #:number 6))
                  (plot-x-far-axis? #f)
                  (plot-y-far-axis? #f))
    (plot (list
           (rectangles-accumulated-y (map second Combined-EnePop-EneOrder)
				     (map third Combined-EnePop-EneOrder))
           (vrule mean-energy)
           (point-label (vector mean-energy (* 3.5 (expt 10 9)))
                       "Average Energy Use"
                       #:color "gray"
                       #:anchor 'left
                       #:point-size 2)
	   (point-label (vector 21000 (* .5 (expt 10 9)))
			"https://en.wikipedia.org/wiki/List_of_countries_by_energy_consumption_per_capita"
                        #:color "gray" #:point-size 0
                        #:anchor 'left
                        #:angle (/ 3.14 2))
           (point-label (vector 22000 (* .5 (expt 10 9)))
			"https://en.wikipedia.org/wiki/List_of_countries_and_dependencies_by_population"
                        #:color "gray" #:point-size 0
                        #:anchor 'left
                        #:angle (/ 3.14 2))
         #;(point-label (vector 2500 2363572220.0) "china")
         (map pop-bar-label-y label-countries)
           )
	  #:height 900
	  #:width 600
	  #:y-label "Population"
	  #:x-label "Energy Consumption kWh"
	  #:y-max  (* 7.5 (expt 10 9))
	  #:out-file "EnergyConsumption-Population-DrRacket-1.png"
	  #:out-kind 'png
     ))
data
The .csv data scraped from wikipedia for use with these plots is in an earlier post, the post with the lines-interval plots. (I didn't know about rectangles then)
#datavisualization #DrRacket #Racekt #HiroakiKoide #KoideHiroaki #小出裕章 #エネルギー #Energy #Population