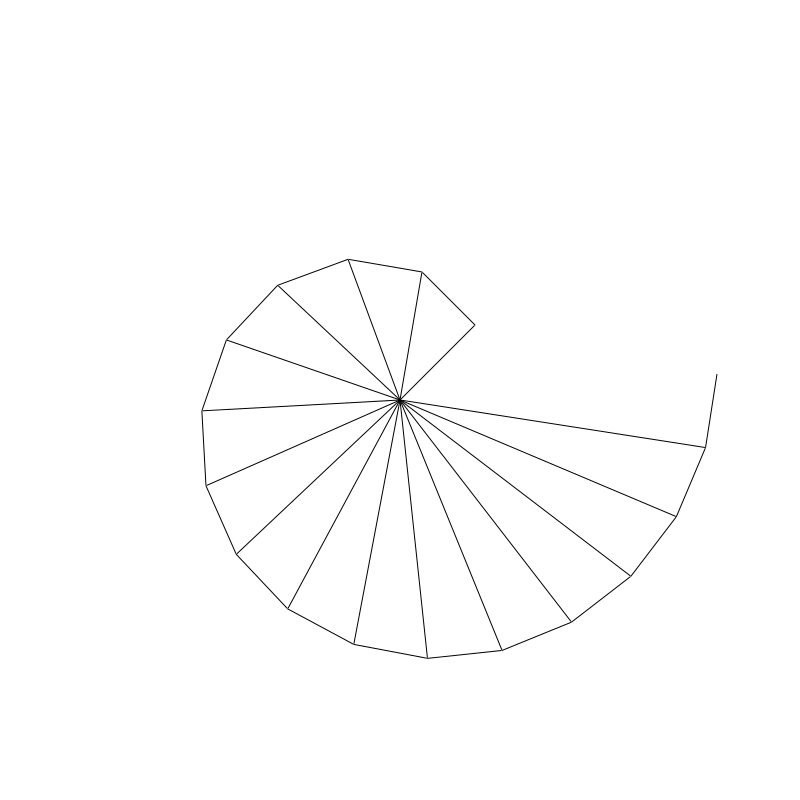
Turtles do a spiral
A Diaspora* post with interesting Python code inspired me to explore Racket's turtles and to learn about radians and the law of cosines.
 (All the italicized words in the previous sentence have endnotes).
A Diaspora* post with interesting Python code inspired me to explore Racket's turtles and to learn about radians and the law of cosines.
(All the italicized words in the previous sentence have endnotes).
Inspired by a Diaspora* post about simple gui programming in Red , I played with gui programming in Racket. Just a few tweaks to the example in Racket's Windowing documentation(fn:2) and a button in a frame shows an insult. Gui programming seemed too complex too learn, but the Red example got me over the off-putting idea. For some tasks, gui-programming might be simpler and shorter than generating html pages.

The code and .csv data are below
It was a good exercise to make slides that show Japanese characters going from top to bottom and the lines going from right to left.

都城の詩人、 富松良夫は「南九州の宮沢賢治」と呼ばれているようです。興味深い人です。
The motivation for the exercise came from last week's opportunity to see a talk about a local poet. Paul Goodman wrote somewhere about the importance of “incidental poetry.” His example was the dedication of a local monument or park. The comment about incidental poetry came to mind again when the speaker said that the local poet Tomimatu Yoshia wrote the local school's song. The writers Ueno Hidenobu and Kawahara Kazuyuki are known for singing a school song by Miyazawa Kenji.

Unless I get a chance to read Practical Typography (by the writer who also did Beautiful Racket)the troubles with punctuation will make me display these poems with html and css3. But in the meantime this code works for the contemplation of simple Japanese poems on a screen.
I had to write an extra utility, character->string and then kept acclimating myself to naming conventions with string-separate. It was while working on these poems that I saw the similarities among the empty list '() and (blank 0) along with cons and vc-append . There never seems to be a need for iteration loops once you get used to recursive procedures, aux or helper functions, and accumulator or keep expressions. Maybe I can use this approach as part of a Ogden's Basic English-style approach to a Basic Scheme (or Basic Racket) that gives humanities students the most widely useful expressions for programming tasks on computers.
Last week's talk about a local poet reminded me of I.A. Richards. I read that he used to put a poem on a slide up before large groups of people. William Empson may have written a poem about the slides.

I like the simple slides, maybe I'll use them to contemplate poetry while staring at a screen. On the other hand commercial presentation software ( PP ) seems too flashy.

The loud colors distract from contemplation on the poem. If putting poems up on a screen can be constructive, a simple way to see simple slides may be useful.
Using DrRacket to show poems in the tradition of I.A. Richards seems appropriate. As learners of poetry and programming we want grounds to approach an “overwhelming sense of correctness” (fn:1) ... to reach a judgment that we can have confidence with.
Plotting tables with DrRacket has been teaching me a lot. It felt wrong to go out of DrRacket and into the shell just to montage (ImageMagick) the row-based and column-based plots together. Racket features plot-pict so it seemed like the right time to start learning the pict library.(fn:1) With picts I was able to vc-append a gray separator between the two plots, and to add pip-arrows-lines to point out connections between the two views.

The plots I work with can become long images. Long picts are awkward to work with in DrRacket. I could only scale to the top, and could not check the lower part of the plot. Enclosing the pict code withpict->bitmap makes iterative development smoother. A bitmap is much easier to scroll in DrRacket.
It took a few attempts to learn how to save the pict->bitmap images to file. I was looking for a basic Scheme-like approach with open-output-file or with-output-to-file but nothing worked. The task of saving plot-pict bitmaps as png files has become my introduction to objects in Racket. You send an object a method and arguments. It didn't make sense to me until reading the ambiguous sentence I just typed. With send you don't send the very next expression somehwere, you send the following expressions to the next expression. So send's second argument (if you see send as a typical Racketfunction) is what gets the rest of the arguments.
The visualizations might be ready to print out and think about.
After putting a table of data into R-style, “long form” lists, Racket's group-by and sort allows for creative labeling and ordering. The hours spent with R/ggplot2 got me ready for “pilfering” ideas into Racket. (fn:2)

Working with this table of fisheries data made it easy to appreciate functional programming with sort. You are free to create a function that will sort, or order, the data. It's simple to adhere to Howard Wainer's rules for “table construction.”(fn:1)

データ表の視覚化で何を気づくかな?「 一本釣漁業」と「囲刺網漁業」はなぜ増えたのかな?
 カニも54年に増えたみたい(fn:2)。それは生態系の理由か経済的な理由か? カニの天敵が減たやろうか、悪影響が出るまで餌が増えたか、 それか、 遠いところから人がカニを水俣に持って来ただろうか?
元の表は原田正純「水俣病」(岩波新書)12ページにあった。
Working with a table full of data worthy of attention is great for keeping focus. Getting data into “long form” as is done with R might not be necessary with Racket, at least not with the simple data I work with for visualizations. The code for this visualization was getting too complex for a few days, I had to go back and get the data into a convenient form. Racket's ->plot-label *number* *digits* makes it easy to arrange for helpful labels.
(“1954” (“mullet” 54453.75 90.75625000000001)

アンケートのデータ表を視覚化した。

(sort labels #:key row-sum >)
In Understanding Graphs and Tables Howard Wainer advises:
Order the rows and columns in a way that makes sense. We are almost never interested in “Austria First.” Two useful ways to order the data are:
a. Size places-Put the largest first. Often we look most carefully at what is on top and less carefully further down. Put the biggest thing first! Also, ordering by some aspect of the data often reflects ordering by some hidden variable that can be inferred. b. Naturally – Time is ordered from the past to the future. Showing data in that order melds well with what the viewer might expect. This is always a good idea.
— Howard Wainer (fn:1)
Howard Wainer's advice came to mind while working with data from a book about Minamata Disease (and pollution or Damage to the Commons in general).

The code to visualize Jun Ui's table of employment data is an attempt to implement Howard Wainer's advice (and general ink-to-data ratio advice for data visualization) with free software: DrRacket and Racket Plot.

As always, the code and data are below.