Racket Plot: Minamata Fishery Decline 1950s
Getting information from a table is like extracting sunlight from a cucumber. (Farquhar & Farquhar, 1891) (fn:3)
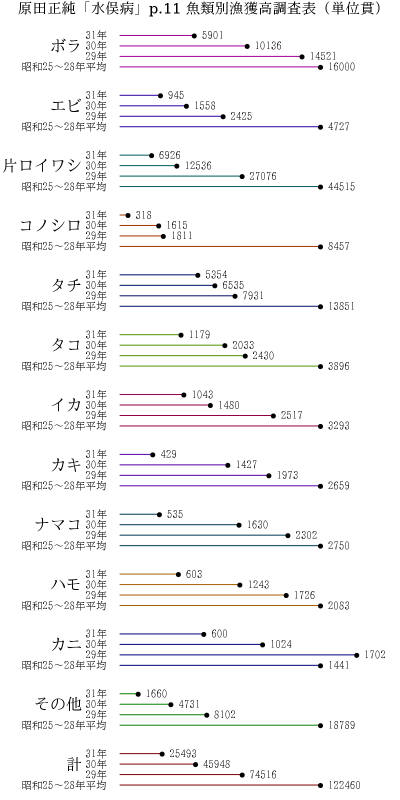
Working with data from Minamata Disease materials seems like a worthy way to learn Racket and Data Visualization. I see graphs of chemical production from the factory that I would like to merge with the fishery depletion data. The units are Kan貫: 3.75kg or 8.6lb. If there is a need, I'll have to translate the fish names and units for an English version.

Hopefully the “Reproducible Research” approach will become common practice everywhere. It would be nice to have tables of data for every visualization we see, it seems like a responsible approach.
It takes a certain sort of focus and patience to create a visualization, but I think the work makes the data tables more meaningful. It's hard to keep your attention on this sort of reading. Maybe visualizations could help. Now I have to print these visualizations out and write essays for them. If the plots help create decent, useful writing they will have served a purpose.

As always the code and data are below, Reproducible Research!!
code

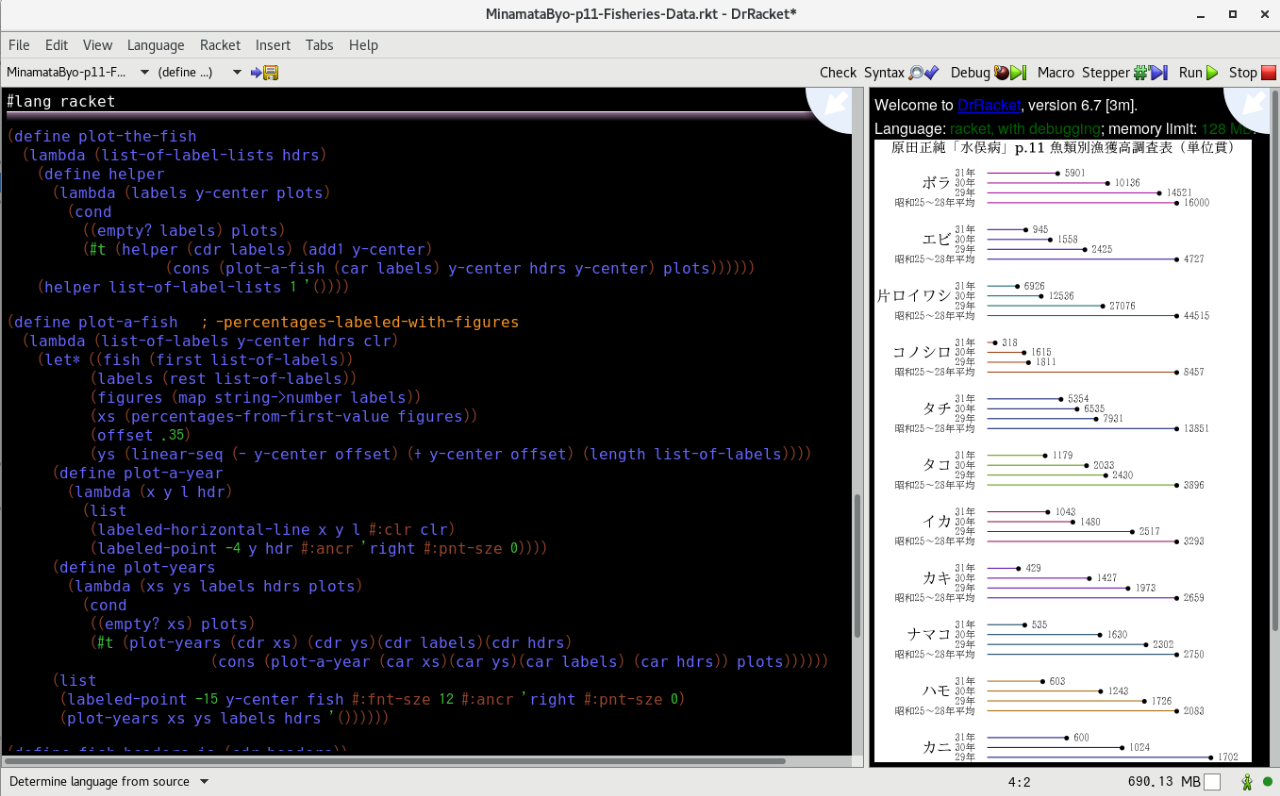
#lang racket

;; Use meaningful names.
;; The Lisp convention is to use full English words separated by dashes.
;; Racket code benefits from the same convention.
;; racket/doc/style/Textual_Matters.html#%28part._names%29
(define my-home (find-system-path 'home-dir))
(define learning-directory "Learning-Minamata")

(define data-file "HM-1-p11-FisheryFigures.csv")
;; 魚種,昭和25〜28年平均,29年,30年,31年
;; ボラ,16000,14521,10136,5901
;; エビ,4727,2425,1558,945
;; 片ロイワシ,44515,27076,12536,6926
;; コノシロ,8457,1811,1615,318
;; タチ,13851,7931,6535,5354
;; タコ,3896,2430,2033,1179
;; イカ,3293,2517,1480,1043
;; カキ,2659,1973,1427,429
;; ナマコ,2750,2302,1630,535
;; ハモ,2083,1726,1243,603
;; カニ,1441,1702,1024,600
;; その他,18789,8102,4731,1660
;; 計,122460,74516,45948,25493
(define data-path (build-path my-home learning-directory data-file))

(define get-path
  (lambda (file-name)
    (build-path (current-directory-for-user) file-name)))

(define get-data
  (lambda (pth)
    (let* ((inp (open-input-file pth))
	   (lines (port->lines inp)))
      (close-input-port inp)
      (map (lambda (s) (string-split
			(regexp-replace* "\"" s "")
				     ","))
	   lines))))

(define fishery-data (get-data data-path))
(define headers (first fishery-data))
;; '("魚種" "昭和25〜28年平均" "29年" "30年" "31年")
(define headers19 (list "1950-53avg " "1954" "1955" "1956"))

(define fishery-labels (cdr fishery-data))

(require plot)
(require plot/utils)

(define horizontal-line
  (lambda (x y #:clr (clr "black")) ;; lne-wdh lne-stl ..etc
    (lines (list (vector 0 y) (vector x y)) #:color clr)))

(define vertical-line
  (lambda (x y #:clr (clr "black"))
    (lines (list (vector x 0) (vector x y)) #:color clr)))

(define labeled-point
  (lambda (x y l #:ancr (ancr 'left) #:fnt-sze (fnt-sze 8) #:pnt-sze (pnt-sze 5)
            #:pnt-clr (pnt-clr 0) #:lbl-angl (lbl-angl 0) )
    (point-label (vector x y) l #:anchor ancr #:size fnt-sze #:point-size pnt-sze
                #:point-color pnt-clr #:angle lbl-angl)))

(define labeled-horizontal-line
  (lambda (x y l #:clr (clr "black") #:ancr (ancr 'left) #:fnt-sze (fnt-sze 8) #:pnt-sze (pnt-sze 5)
            #:pnt-clr (pnt-clr 0) #:lbl-angl (lbl-angl 0))
    (list
     (horizontal-line x y #:clr clr)
     (labeled-point x y l #:ancr ancr  #:fnt-sze fnt-sze #:pnt-sze pnt-sze
            #:pnt-clr pnt-clr #:lbl-angl lbl-angl))))

(define labeled-vertical-line
    (lambda (x y l #:clr (clr "black") #:ancr (ancr 'bottom) #:fnt-sze (fnt-sze 8) #:pnt-sze (pnt-sze 5)
            #:pnt-clr (pnt-clr 0) #:lbl-angl (lbl-angl 0))
      (list
       (vertical-line x y #:clr clr)
       (labeled-point x y l #:ancr ancr  #:fnt-sze fnt-sze #:pnt-sze pnt-sze
            #:pnt-clr pnt-clr #:lbl-angl lbl-angl))))

(define lines-points-plot
  (lambda (list-of-ys clr)
    (let* ((len (length list-of-ys))
           (xs (linear-seq 1 len len)))
      (list
       (lines (map vector xs list-of-ys) #:color clr)
       (points (map vector xs list-of-ys) #:color clr #:sym 'fullcircle)))))

(define percentages-from-first-value
  (lambda (list-of-numbers)
    (define standard (first list-of-numbers))
    (define percent-of-standard
      (lambda (num)
	(* 100 (/ num standard))))
    (map percent-of-standard list-of-numbers)))

(define plot-the-fish
  (lambda (list-of-label-lists hdrs)
    (define helper
      (lambda (labels y-center plots)
        (cond
          ((empty? labels) plots)
          (#t (helper (cdr labels) (add1 y-center)
                     (cons (plot-a-fish (car labels) y-center hdrs y-center) plots))))))
    (helper list-of-label-lists 1 '())))

(define plot-a-fish   ; -percentages-labeled-with-figures
  (lambda (list-of-labels y-center hdrs clr)
    (let* ((fish (first list-of-labels))
	   (labels (rest list-of-labels))
	   (figures (map string->number labels))
	   (xs (percentages-from-first-value figures))
	   (offset .35)
	   (ys (linear-seq (- y-center offset) (+ y-center offset) (length list-of-labels))))
      (define plot-a-year
	(lambda (x y l hdr)
	  (list
	   (labeled-horizontal-line x y l #:clr clr)
	   (labeled-point -4 y hdr #:ancr 'right #:pnt-sze 0))))
      (define plot-years
	(lambda (xs ys labels hdrs plots)
	  (cond
	   ((empty? xs) plots)
	   (#t (plot-years (cdr xs) (cdr ys)(cdr labels)(cdr hdrs)
			   (cons (plot-a-year (car xs)(car ys)(car labels) (car hdrs)) plots))))))
      (list
       (labeled-point -15 y-center fish #:fnt-sze 12 #:ancr 'right #:pnt-sze 0)
       (plot-years xs ys labels hdrs '())))))

(define fish-headers-ja (cdr headers))

(parameterize
    (
     (plot-title "原田正純「水俣病」p.11 魚類別漁獲高調査表 (単位貫)")
     (plot-x-axis? #f)
     (plot-x-far-axis? #f)
     (plot-x-label #f)
     (plot-y-axis? #f)
     (plot-y-far-axis? #f)
     (plot-y-label #f)
     (plot-width 400)
     (plot-height 800)
     )
  (plot
     (plot-the-fish (reverse fishery-labels) headers19) ; fish-headers-ja
     #:x-min -60 #:x-max 140
     #:y-min .4 #:y-max 13.4
     #:out-file "fisheries-figures-ja-2.png"
     #:out-kind 'png))

- (fn:1) Understanding Graphs and Tables, Herbert Wainer
- http://www.jstor.org/stable/1176346
- Introduction to Howard Wainer Diaspora* comments
- To learn more:
- https://www.minamatadiseasemuseum.net/
- Jun Ui: http://archive.unu.edu/unupress/unupbooks/uu35ie/uu35ie0c.htm > Environmental pollution problems represented by Minamata disease, Itai-itai disease, and Yokkaichi asthma have all become well-known phenomena that are a serious threat to life and health. These problems were so serious that they engendered a new word, kogai (destruction of the public domain), which is now in common parlance. In this regard, there is no doubting the fact that Japan has come to be known worldwide as the nation with the most serious environmental pollution. However, it must be kept in mind that Japan's environmental destruction is not a recent phenomenon, but was also a very prominent feature of the social landscape from the very beginning of the country's modernization and industrialization period. #Racket #DrRacket #visualization #DataVisualization #HowardWainer