Racket Plot: Urban Population Slum Numbers
Getting information from a table is like extracting sunlight from a cucumber. (Farquhar & Farquhar, 1891) (fn:3)

With repetition I'll be able to abstract and simplify the code to produce an alternative for histograms(bar-charts). With that in mind, I re-visited some data from Mike Davis's Planet of Slums to make this Percent-Scale-Labeled-Line plot of data.

The countries are ordered by millions of residents in slums, but the lines show what percentage of the urban population is taken up by those millions. The USA has a million more people in slums than Egypt, but twelve point eight million people is smaller percentage of its urban population. Later it might be interestingto compare my too-complex gnuplot code with my getting-simpler Racket code for this data and visualization.
While working with the PercentScale-LineLabel code, some advice came to mind. Visualizations get better with higher ink-to-information ratios so we should avoid labels and any other “presentation bureacracy” when possible. I also felt that it was disorienting to label the percent-scaled lines with the figure for millions of people. With an Howard Wainer article (fn:3) coming to mind, it seemed better to make the visualization simpler, more table-like, but still with the aid to understanding provide by lines showing how the figure for millions relates to a particular country's total urban population. I keep the lines because of a few paragraphs from Solomon Messing's blog post(fn:4): > ... judgements about position relative to a baseline are dramatically more accurate than judgements about angles, area, or length (with no baseline).
I'm hoping the lines and position of the percentage figures will be helpful since they all share the same baseline. And I thing the figures in millions needs some sort of context for each country.

I suppose the plot above could help with the book's table. With more time I'd like to work in a line that shows the percentage of the entire world's slum population in each country. Or maybe a line that shows each country's population in proportion to the country with the greatest population. But I suppose it's easy enough to answer certain questions with this simple visualization. It's not too hard to mentally calculate that Ethiopia and Tanzania, while having a high proportion of their urban populations in slums, have less slum populations that are less than ten percent as large as China's.
Other questions might create a desire to visualize population data from the United Nations. What proportion of a country's population is urban? How are those proportions changing. I used to play with UN population data and gnuplot.
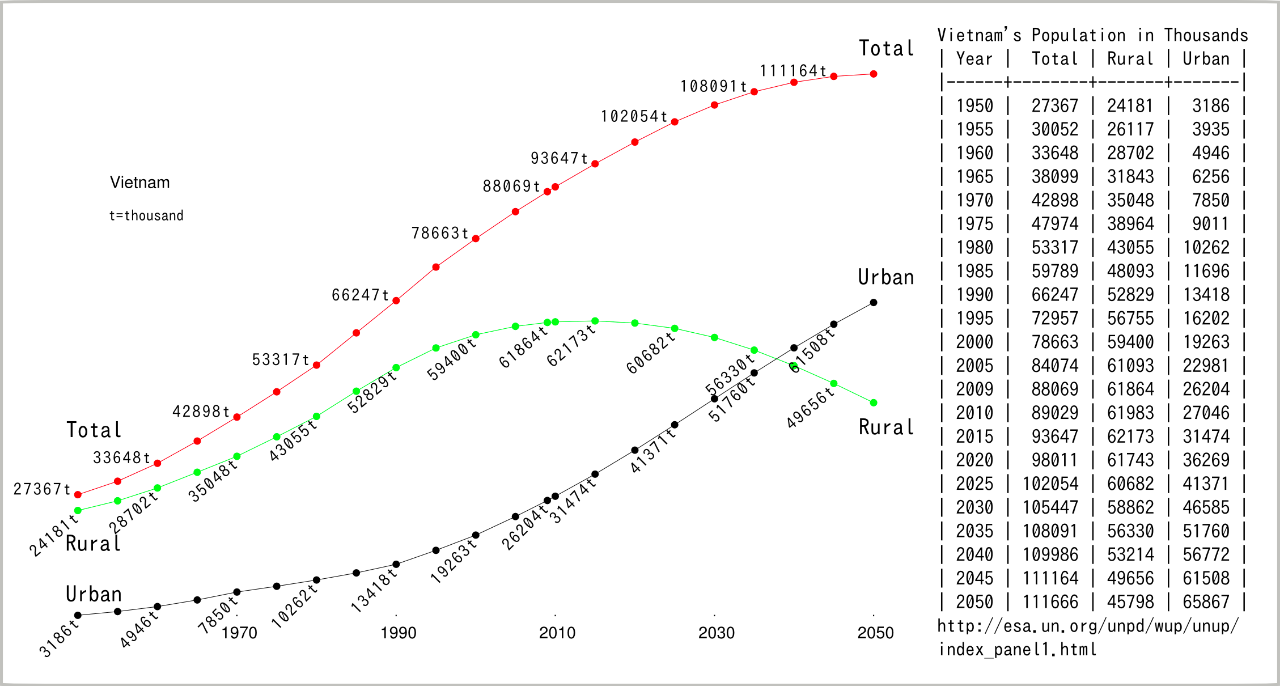
It would be nice to re-visit the UN population data in DrRacket one day. I remember seeing the population changes for the Philippines showed the same shapes/tendencies as the world population. The UK, USA, and Japan were unusual, like all the “advanced” or industrialized countries, most people moved to urban areas decades ago. I wonder how “consensual” these population trends from country to city are, or how much legal and economic force are involved. With the Philippines an anecdote about people losing their land to a Tiger Woods golf course comes to mind. The mass dislocations caused by dams in India(Narmada Valley) and China(Three Gorges) come to mind, and also in Haiti as written about by Paul Farmer. Arundhati Roy's powerful essay deserves to end dam construction funding and start massive dam removal policy.
Data like these populations figures from serious books and on-line sources might be simple and worthwhile enough for learning exercises. There may be a “Graded Direct Method” way of going from simple lists, recursion, helper(or auxiliary) functions to data visualization. I wonder if there is a General Education(Liberal Arts) one-semester programming course waiting to be discovered. I'd like to take a programming and visualization course that prepares us to take part in “The Great Conversation” of human history, and the policy making that threatens to end our history...
Here's proof that the code worked in DrRacket 6.7:

And more proof... But simply copying the code from a Writefreely post and pasting it into DrRacket did not work. Maybe WriteFreely does something to the quotes, I was getting errors from the line that defined the Data-File, but didn't have time to figure out the details(specific trouble)...

As always the code is below, and the data too:
Mike Davis, whose first book about Los Angeles, City of Quartz, burst into bestsellerdom and put him on the map as this country's most innovative urban scholar, has since written about everything from the literary destruction of LA to Victorian holocausts of the 19th century and the potential avian flu pandemic of our own moment. He has most recently turned his restless, searching brain upon the global city in a new book, Planet of Slums, whose conclusions are so startling that I thought they should be the basis for our conversation. — Tom Engelhadt (TomDispatch) and Mike Davis Interview (fn:1)
TD: … The book you wrote before Planet of Slums was The Monster at Our Door on the avian flu and I realize, as we talk, that it's thematically linked to Planet of Slums because it's also about a kind of planetary slumification – of agriculture.
MD: A Dickensian world of Victorian poverty is being recreated, but on a scale that would have staggered the Victorians. So, naturally, you wonder whether the preoccupation of the Victorian middle classes with the diseases of the poor isn't returning as well. Their first reaction to epidemics was to move to Hampstead, to flee the city, to try to separate from the poor. Only when it was obvious that cholera was sweeping from the slums into middle-class areas anyway, did you get some investment in minimum sanitation and the public-health infrastructure. The illusion today, as in the 19th century, is that we can somehow separate ourselves, or wall ourselves off, or take flight from the diseases of the poor. I don't think most of us realize the huge, literally explosive concentrations for potential disease that exist.
More than twenty years ago, the leading infectious disease researchers in a series of volumes warned about new and reemerging diseases. Globalization, they observed, was causing planetary environmental instability and ecological change likely to shift the balance between humans and their microbes in a way that could bring about new plagues. They warned as well of the failure to create a disease-monitoring or public-health infrastructure commensurate with globalization.
In my book, I looked at the relationship between the pervasive global slum, everywhere associated with sanitation disasters, with classical conditions favoring the rapid movement of disease through human populations; and on the other side, I focused on how the transformation of livestock production was creating entirely new conditions for the emergence of diseases among animals and their transmission to humans.
Influenza is an important paradigm for infectious disease. …
- (fn:1) http://www.tomdispatch.com/post/82655/
- (fn:2) http://www.tomdispatch.com/post/82790/
- (fn:3) Understanding Graphs and Tables, Herbert Wainer
- http://www.jstor.org/stable/1176346
- Introduction to Howard Wainer Diaspora* comments
- (fn:4) https://solomonmg.github.io/blog/2012/visualization-series-insight-from-cleveland-and-tufte-on-plotting-numeric-data-by-groups/
code for later, simpler visualizatoin
#lang racket

;; use for DrRacket
(current-directory-for-user  "/home/brian/Racket/Visualizations/Cities-Slums/")

(define Data-File  "SlumPopluationPercentsMillions.csv")

(define get-path
  (lambda (file-name)
    (build-path (current-directory-for-user) file-name)))

(define get-data
  (lambda (pth)
    (let* ((inp (open-input-file pth))
	   (lines (port->lines inp)))
      (close-input-port inp)
      (map (lambda (s) (string-split
			(regexp-replace* "\"" s "")
				     ","))
	   lines))))

(define csvf->dict
  (lambda (file-name)
    (get-data (get-path file-name))))

(define SlumResident-UrbanPopPercents-PersonMillions-dict
  (csvf->dict Data-File))

(define headers (car SlumResident-UrbanPopPercents-PersonMillions-dict))
(define SlumRes-UrbPrct-PplMlls-dict
  (cdr SlumResident-UrbanPopPercents-PersonMillions-dict))

(require plot)
(require plot/utils)

(define hline
  (lambda (x y #:clr (clr "black")) ;; lne-wdh lne-stl ..etc
    (lines (list (vector 0 y) (vector x y)) #:color clr)))

(define pnt-lbled
  (lambda (x y l #:ancr (ancr 'left) #:fnt-sze (fnt-sze 8) #:pnt-clr (pnt-clr 0) #:lbl-angl (lbl-angl 0) #:pnt-sze (pnt-sze 5))
    (point-label (vector x y) l #:anchor ancr #:size fnt-sze #:point-color pnt-clr
		 #:angle lbl-angl #:point-size pnt-sze)))

(define plot-a-country
  (lambda (lst y)
    (let ((nme-mil (string-append (first lst) ": " (third lst) "M"))
	  (prcnt (string->number (second lst)))
	  (pct-lbl (string-append (second lst) "%")))
      (list
       (pnt-lbled 0 (+ y .3) nme-mil #:fnt-sze 12 #:pnt-sze 0)
       (hline prcnt y)
       (pnt-lbled prcnt y pct-lbl #:ancr 'top #:fnt-sze 10)))))

(define plot-countries
  (lambda (dct)
    (define helper
      (lambda (dct n plts)
	(cond
	 ((empty? dct) plts)
	 (#t (helper (cdr dct) (add1 n)
		     (cons (plot-a-country (car dct) n) plts))))))
    (helper dct 1 '())))


(parameterize (
               (plot-title "Largest Slum Populations by Country, % of Country's Urban Population")
               (plot-x-axis? #f)
               (plot-x-label "Source: Mike Davis _Planet of Slums_")
               (plot-x-far-axis? #f)
               (plot-x-ticks no-ticks)
               (plot-x-far-ticks no-ticks )
               (plot-y-axis? #f)
               (plot-y-far-axis? #f)
               (plot-y-label #f)

	       )
  (plot (plot-countries SlumRes-UrbPrct-PplMlls-dict)
   #;(plot-a-country
		      (last SlumRes-UrbPrct-PplMlls-dict) 5)
   #:x-min 0 #:y-min 0
   #:x-max 105 #:y-max 21
   #:width 600 #:height 1000
   #:out-file "PlanetOfSlumsMikeDavisDataTable3.png"
   #:out-kind 'png))
code for first visualization
#lang racket
;; use for DrRacket (current-directory-for-user “/home/brian/Racket/Visualizations/Cities-Slums/”)
(define Data-File “SlumPopluationPercentsMillions.csv”)
(define get-path (lambda (file-name) (build-path (current-directory-for-user) file-name)))
(define get-data (lambda (pth) (let* ((inp (open-input-file pth)) (lines (port->lines inp))) (close-input-port inp) (map (lambda (s) (string-split (regexp-replace* “\“” s “”) “,”)) lines))))
(define csvf->dict (lambda (file-name) (get-data (get-path file-name))))
(define SlumResident-UrbanPopPercents-PersonMillions-dict (csvf->dict Data-File))
(define headers (car SlumResident-UrbanPopPercents-PersonMillions-dict)) (define SlumRes-UrbPrct-PplMlls-dict (cdr SlumResident-UrbanPopPercents-PersonMillions-dict))
(require plot) (require plot/utils)
(define hline (lambda (x y #:clr (clr “black”)) ;; lne-wdh lne-stl ..etc (lines (list (vector 0 y) (vector x y)) #:color clr)))
(define pnt-lbled (lambda (x y l #:ancr (ancr 'left) #:fnt-sze (fnt-sze 8) #:pnt-clr (pnt-clr 0) #:lbl-angl (lbl-angl 0) #:pnt-sze (pnt-sze 5)) (point-label (vector x y) l #:anchor ancr #:size fnt-sze #:point-color pnt-clr #:angle lbl-angl #:point-size pnt-sze)))
(define plot-a-country (lambda (lst y) (let ((nme (first lst)) (prcnt (string->number (second lst))) (lbl (third lst))) (list (pnt-lbled 0 (+ y .3) nme #:fnt-sze 12 #:pnt-sze 0) (hline prcnt y) (pnt-lbled prcnt y lbl #:ancr 'top-right)))))
(define plot-countries (lambda (dct) (define helper (lambda (dct n plts) (cond ((empty? dct) plts) (#t (helper (cdr dct) (add1 n) (cons (plot-a-country (car dct) n) plts)))))) (helper dct 1 '())))
(parameterize ( (plot-title “Larget Slum Populations by Country: Mike Davis Planet of Slums”) (plot-x-label “Scale: %Urban Population in Slums, Label: Millions of People”) (plot-x-far-label “Scale: %Urban Population in Slums, Label: Millions”) (plot-x-far-ticks (linear-ticks #:number 10)) (plot-y-label #f) (plot-y-ticks no-ticks) ) (plot (plot-countries SlumRes-UrbPrct-PplMlls-dict) #;(plot-a-country (last SlumRes-UrbPrct-PplMlls-dict) 5) #:x-min 0 #:y-min 0 #:x-max 100 #:y-max 21 #:width 600 #:height 1000 #:out-file “PlanetOfSlumsMikeDavisDataTable1.png” #:out-kind 'png))
data
Country,%Urban of Population,Millions of People
China,37.8,193.8
India,55.5,158.4
Brazil,36.6,51.7
Nigeria,79.2,41.6
Pakistan,73.6,35.6
Bangladesh,84.7,30.4
Indonesia,23.1,20.9
Iran,44.2,20.4
Philippines,44.1,20.1
Turkey,42.6,19.1
Mexico,19.6,14.7
South Korea,37.0,14.2
Peru,68.1,13.0
USA,5.8,12.8
Egypt,39.9,11.8
Argentina,33.1,11.0
Tanzania,92.1,11.0
Ethiopia,99.4,10.2
Sudan,85.7,10.1
Vietnam,47.4,9.2
Album Link
#Racket #DrRacket #visualization #gnuplot #DataVisualization #HowardWainer #slums #MikeDavis #slumification #agriculture #BirdFlu #AvianInfluenza #slumificationofagriculture