3D Visualization Empower Data Center Management
As data center complexity continues to increase, Data Center Infrastructure Management (DCIM) solutions must become essential tools in the IT stack. With the right tool, you can reduce costs, increase productivity, optimize your physical space, and improve system integration.
In this article, we introduce Hightopo 3D visualization tool to build a comprehensive 3D data center management system that brings together various IT and facilities systems, including generators and servers, to perform power usage effectiveness reporting, data center visualization, dashboard reporting, and, ultimately, control to improve the data center’s performance and efficiency.
From macro to micro

Utilizing 3D virtual simulation to show eath panorama. This can be easily archived by the HT (ht-for-web, hightopo 3d visualization SDK) build-in spherical mesh applying earth surface texture. And by accessing the latitude and longitude information of each data center location, the position of the coordinate point can be automatically generated, so that we can see each location in all parts of the world more intuitively.
Even though HT supports GIS by integrated the opensource Cesuim solution(check the FAQs session at the end of this article), it’s unnecessary to use WebGIS related functional modules in this certain scenario, as to using simple trigonometric functions to perform spherical coordinate algorithm calculations to achieve the desired effect. In contrast, this simple solution will be much lighter and faster, and it does not even require the intervention of modeling, which will greatly reduce the implementation cost and cycle.
Although it can’t dynamically load the map details through LOD(Level of Details), the scene interaction design can also display various visual effects more freely. For example, in this demo, we switching scenes from the earth to region, to building, to the data center, then to the cabinet by clicking highlight elements.
Dashboard Reporting/ PUE reporting
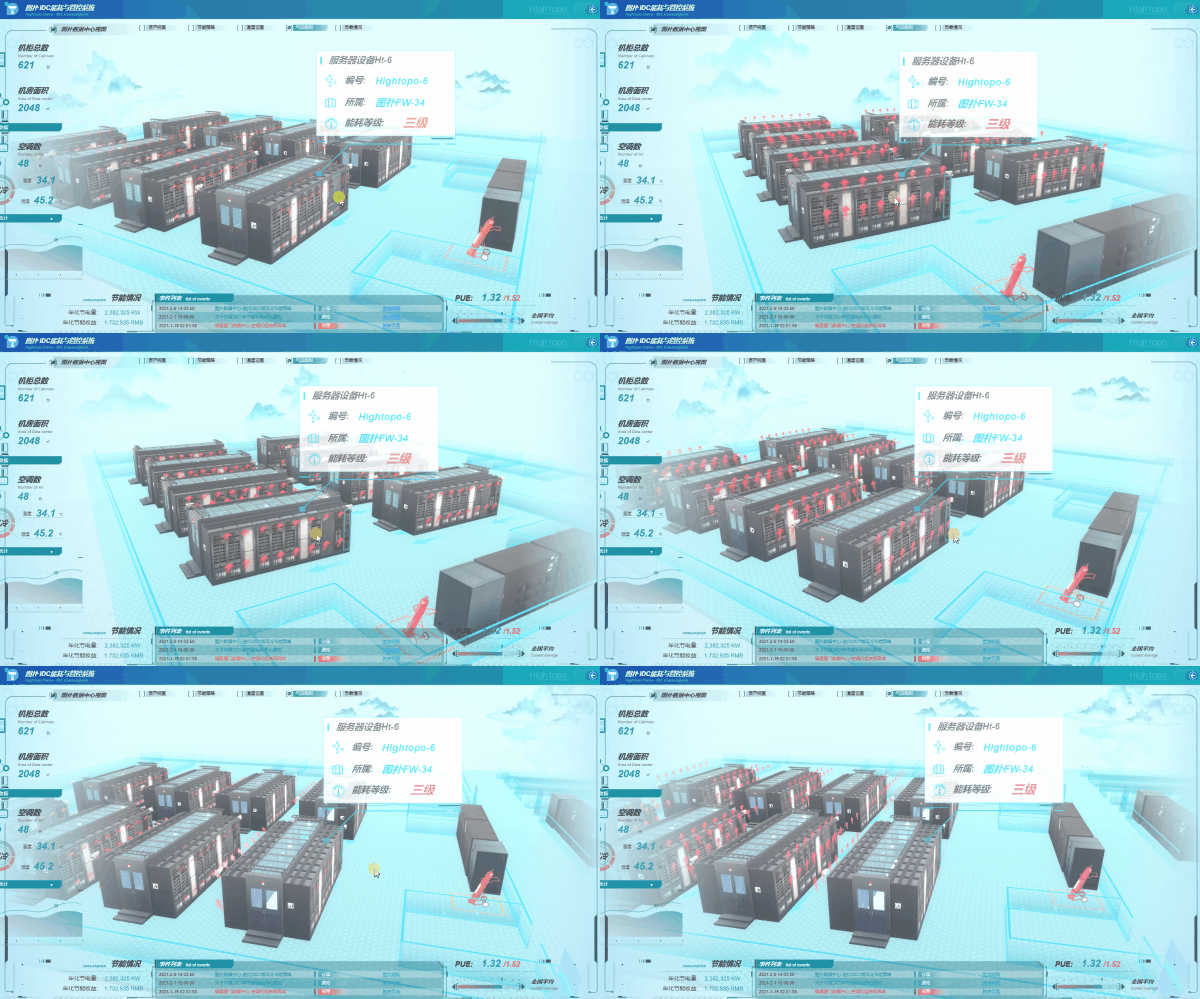
DCIM visualization solution integrated data center information such as numbers of cabinets, area of the data center, numbers of AC, PUE(Power Usage Effectiveness), CADE (Corporate Average Datacenter Efficiency), energy consumption rate etc, and display the data on the dashboard on real-time, average, and peak power use. This helps decision-makers to observe various objects to the greatest extent and get an actionable insight faster, better.
Also, as a monitoring system, early-warming and alert is a must. Set up the EDI direct connection between data center sensors and our visualization dashboard, all the alert information will be display on the dashboard in real-time. Setting the threshold, when the data value triggers the alert, decision-makers will get a notification immediately.
IT Assets Management & Visualization
Assets visualization module follows the level of interactive, display each asset status. Integrated lifecycle management functionality, maintain an accurate inventory of data center assets and real-time views across your entire data center, including equipment in racks like servers, storage, networking equipment, rack PDUs, patch panels and even applications. Get the latest and detailed information on assets, for instance, make, model, serial number, name, rack location, RU position, configuration, data ports, connectors, protocols, data rates, power connectors, voltage, watts, amps, purchase price, purchase date, installation date, warranty period, maintenance dates, asset status and more.
Furthermore, Fuzzy Search /Approximate String Matching is supported, quickly locating desire assets and get detailed info.


Capacity Management & Optimization
One of the most important things you need to keep tabs on in your data center is whether it’s reaching capacity. Essentially, visualizing manage network and device resources, power load, cooling capacity, and storage in various charts or tables to get a better insight.
It helps managers decide where to put additional servers and other IT equipment in terms of optimum operational efficiency from a power and cooling perspective. Also, it helps reduce downtime by analyzing the data center infrastructure and using simulations to highlight areas suffering from a lack of redundancy or capacity constraints.
Ultimately, combine with a surveillance system, allows the integration of PDU(Power Distribution Unit) monitoring. Empower DevOps to check capacity and energy consumption based on different areas. For instance, check and statistics based on each floor, each room, each cabinet for an institutive insight.

Pipeline Lightweight Visualization
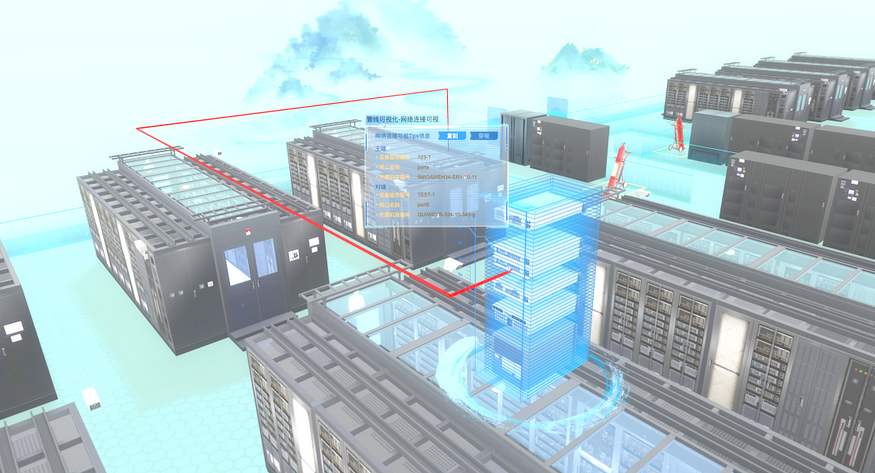
Pipeline visualization usually focuses on network links, HVAC pipelines, electrical wiring. However, most of the pipeline is underneath the ground or hiding inside the wall, which makes it hard to do traditional 3D modeling. On the other hand, in the operation aspect, there is no need for a real position of the pipeline, we are more interested in the monitoring and alert.
Therefore, Hightopo brings a special pipeline visualization algorithm to generate pipelines that link from one equipment to another. Integrate with real data sourced from the control system, visualize and monitor network interface, HVAC pipelines (water-cooled air conditioners, water towers, chillers, cooling pumps, constant humidity machines), electrical pipelines (transformers, distribution boxes, battery packs, battery cabinets, switch cabinet, control cabinet) and other pipelines.

Environmental Monitoring
In a data center, there are many pieces of hardware and equipment that make up the moving parts necessary to protect critical information. It’s crucial to ensure that a colocation facility is committed to keeping track of all environmental variables for each piece of equipment. This helps the facility’s technical team remain aware of issues requiring corrective action, and enables them to enact the preventative measures necessary to avoid these issues in the future. Proper utilization of these environmental monitoring tools will allow the data center provider to see which system is using which resources, in turn positioning the facility for optimal use.
- Power & Voltage Monitor types of equipment info such as the input and output voltage, electric current, power, battery voltage, status of rectifier, inverter, battery and other components. Record and alarm when the abnormal status occurs.
- Temperature & Humidity Connecting to the data center IOT device( temperature & humidity sensors) to get the point-to-point data and display them in 3d heatmap. Many data centers these days installed sensors along with high, medium, low vertically. Utilizing the 3D thermal cloud map brings a more intuitive visual experience and quickly locates the heating conditions of the equipment on each cabinet.

- Airflow Proper airflow within the data center is closely tied to the facility’s air conditioning system. Maintaining airflow will work in conjunction with temperature and humidity control, acting as a third regulator for consistency. According to the data transmitted by the temperature and humidity sensor, a real-time airflow map — CFD (Computational Fluid Dynamics) is formed, so that the flow direction and distribution of cold and hot airflow in the computer room can be clearly seen.

- Security Management (Smoke & Fire Suppression, Access Control) Smoke and fire alarms are wired into the alert system so that in the event of a fire, the alarm will alert the technical team in order to tend to the facility’s critical equipment as soon as possible. Access Control is another crucial part of security management. Integrated with video surveillance and access control system, allows visualizing all the surveillance cameras and access control location, view the real-time camera footage, get historical information about staff enter and exit. HT visualization tool extends from vanilla HTML5, which can only support MP4, OGG format of video. However, steaming RTSP can be achieved by converting RTSP to HLS. Furthermore, the access control system supports facial recognition and records the unauthorized person. Emerging video fusion technology (using texture + algorithm to process irregular shapes, video correction, color correction) to achieve the effect of virtual and real scene combine together.

- Energy Consumption Monitoring Adopt a visual energy-saving strategy, use the intelligent algorithm provided by the Hightopo, calculate the current equipment and environment temperature, and automatically recommend power for each cooling equipment. Optimize the airflow of air conditioning in the data center to reducing energy consumption and to effectively cooling.

- Early Warning A comprehensive warning and alarm system is integrated. Including event self-diagnosis, analysis, and other functions. For events that exceed the performance threshold, it will show the warning information and notify the DevOps team. Saving historical information and alarm events also supported .

Conclusion
Hightopo DCIM tool ties together data from the IT side — virtual machine, server, storage or network equipment — and data from the facilities side — cooling, power distribution unit, uninterruptible power supply, sensors, or generators into an overarching monitoring and analytics environment that lets them make better decisions, optimize the use of their capital spending and increase the overall efficiency-related not only to power but also to capacity, utilization, and operational aspects.
Furthermore, Hightopo DCIM tool is also a good fit for edge data centers, which likely have few or no IT staff on-site. No software is required at edge sites, and they can be monitored remotely — from any device that supports a web browser.
FAQs
How to make a 3d model like this?
We recommend clients provide satellite images, design sketches, aerial views of the property, CAD drawings, on-site photos, etc to designers for modeling.
I already have BIM(Building Information Modelling), can we use that for web display?
BIM, offers a digital representation of the real facility, not only the basic shape of the building but also including function systems (HVAC, electrical) and aesthetics (walls, roof, windows). Therefore, BIM files are very heavy in size, from a hundred MB to a few GB. This is almost impossible for the web where all display content is loaded in real-time.
Although HT encapsulates ht-bim.js to read the IFC format BIM file and dynamically load part of the model and then rendering on the web in real-time for a faster display, in real-world projects, we still need to consider various facts to analyze whether to use bim or not. For instance, visualize underneath pipeline which is impossible to re-modeling and has to use the bim. But for most cases, we do not suggest use bim as it’s mainly for construction purposes and does not look appealing. Re-modeling the property and minimum file size by using texture to present details ensures efficient loading and smooth operation on web pages.