A logistics park is an industrial area specifically designed for storage, management, distribution and transportation of various goods. In addition, companies operating from logistics parks often use them to assemble, package, process or do light manufacturing of products. Looking ahead to the next 2 to 10 years, a predicted surge in the preference for digital transformation will bring fundamental changes to the way warehouses operate. Accordingly, the adoption of disruptive warehouse digitalization will reach its apex.
In this article, we will introduce the HT for Web to create digital twins of a logistics park to open up upstream and downstream systems and utilize smart hardware to achieve data linkage. Covers modules such as (i)daily management of the park, (ii)traffic flow monitoring, (iii)access monitoring, (iv)warehouse management and monitoring and other aspects. With the help of this comprehensive management warehousing system, visualize and analyse the industry park to improve management and work efficiency of the logistics park, and to reduce labour and management costs.
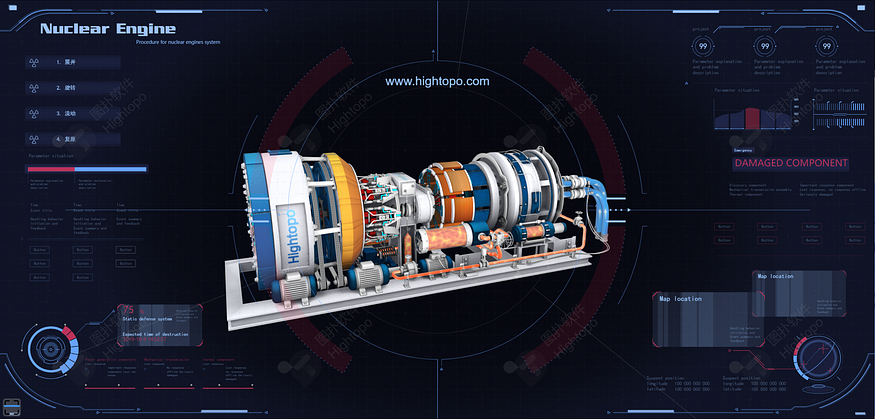
Lightweight 3D Model
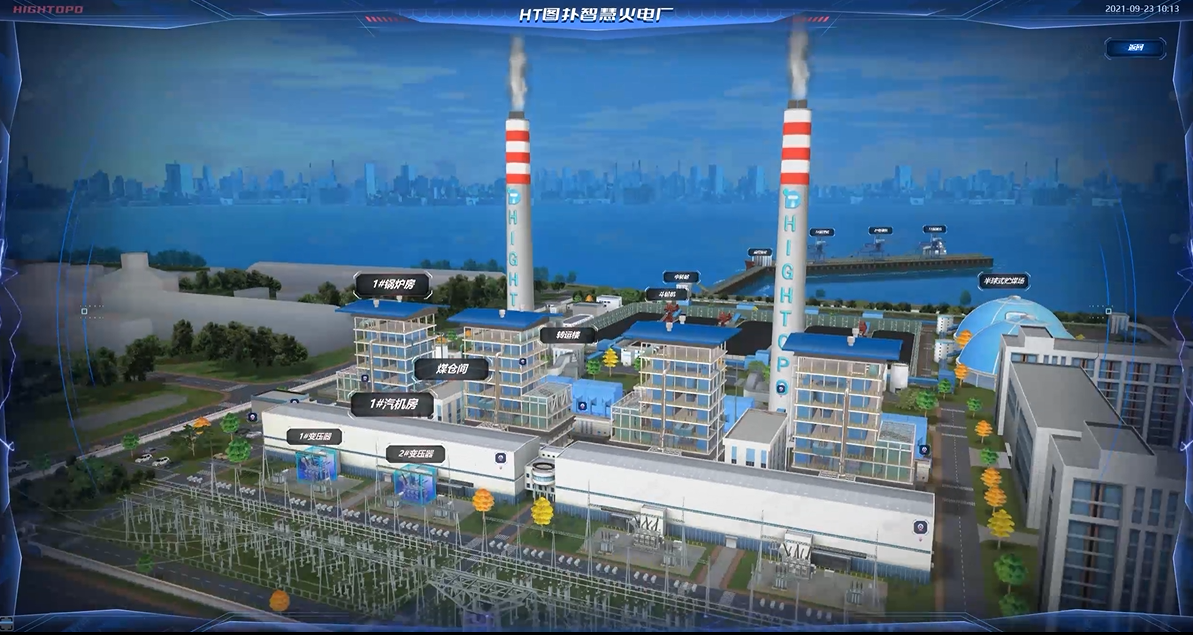
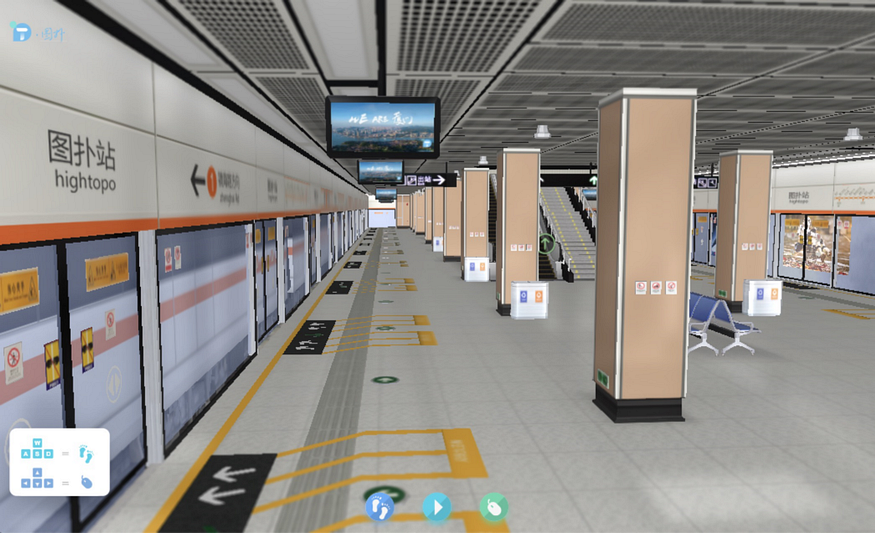
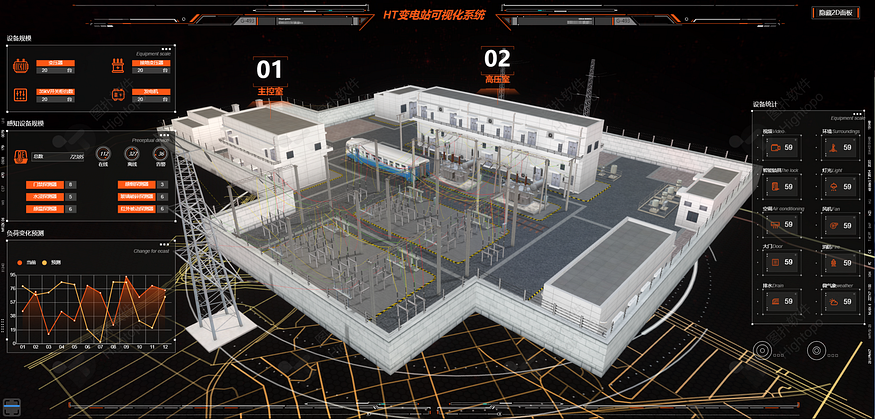
HT for Web (refer as HT below) supports multiple types of model rendering, adopts lightweight yet photorealistic 3D modelling technology. It also supports importing BIM model files in IFC format to generate scenes, and supports rendering oblique photography model files in 3D Tiles format.
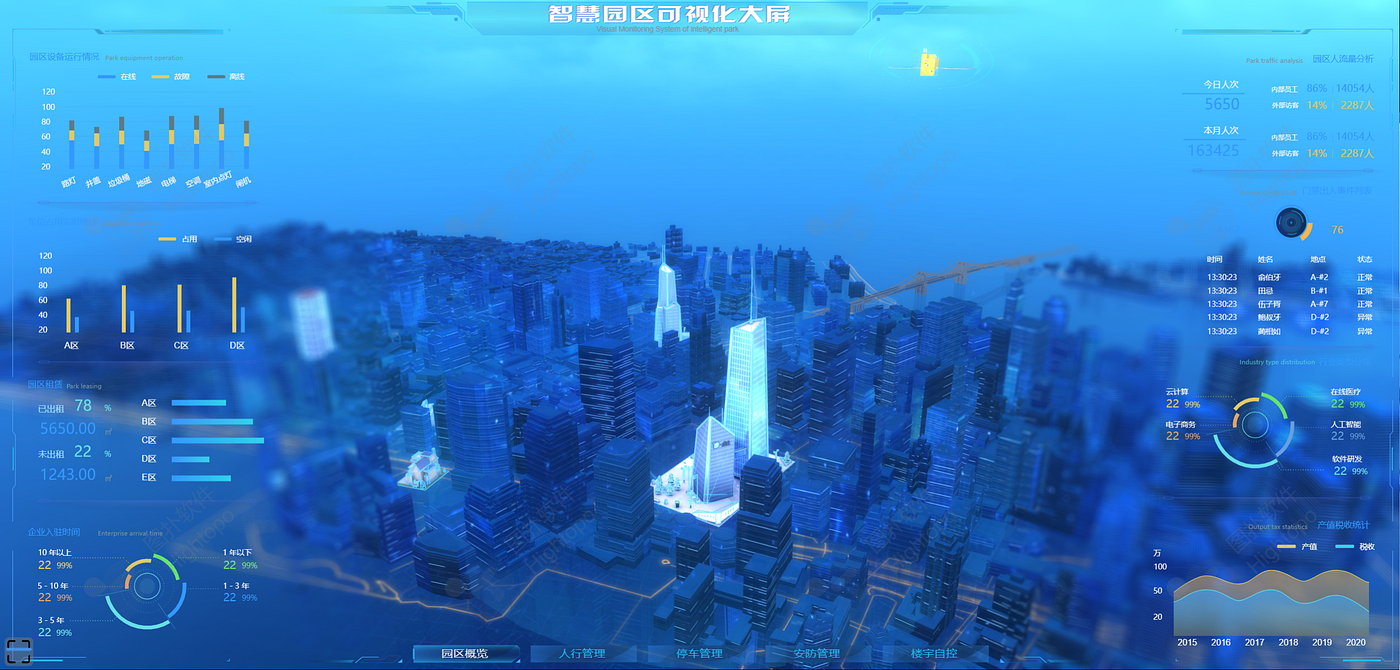
The system comes with an interactive 3d scene and a detailed 2d data panel along the left and right sides to display the data. The 3d scene can be zoomed, panned, and rotated, and each device in the scene can respond to interactive events.
Daily Management of Logistics Park
environment monitory visualization
Integrate the weather system to HT visualization management system, to monitor the environment in the park, collect environmental data from the aspects of temperature, humidity, carbon dioxide, PM2.5, etc., and display it in real-time on the 2D panel.
green energy management
In a large scale logistics park, energy-consuming is a critical aspect to handle and manage. Ultize HT powerful data visualization system to get real-time data about power consumption and power generation to help park operators get insights on the overview energy usage.
- EV Charging Station
Vehicle charging piles are set up in many places in the park, and the energy-saving contribution of the park charging piles and real-time power monitoring is displayed through HT 2D visualization. And with the 3D effect, the charging piles in the park are equipped with different colours to check the charging status of the vehicles and abnormal warnings. HT’s 2D panel is bound to chart data, and 2D and 3D are seamlessly integrated and reused in three-dimensional space.
2. PV Roofing and Solar Street Light

As a distributed photovoltaic project, the photovoltaic roofs is combined with charging piles, new energy vehicles and smart street lights. It uses photovoltaic modules installed on the roof to generate electricity. It is stored in the battery through a charging device or directly supplied to electric vehicles for charging. Photovoltaic roofs also provide power transmission for street lights, public facilities and other facilities in the park to achieve the effect of energy saving and emission reduction. Data was seamlessly integrated into 2D panels such as daily/cumulative electricity storage, power generation, discharge etc.
surveillance system
Multiple surveillance cameras have been installed in various corners of the park and integrated into HT visualization system. Realize the detection and query of the operation status of equipment which related to various video surveillance systems. Once the operation and maintenance system finds that the operation status of the video surveillance system equipment is abnormal, it will immediately automatically send a fault alarm to the operation and maintenance management centre.
Optimized vehicle and dock management
With smart video, site operators can create an optimized vehicle and load management workflow — from truck entry to docking and cargo pickup. HT visualization solution achieves this with a dashboard that displays the status of each loading dock, allowing vehicles to be directed efficiently as soon as they register at the park’s security checkpoint. Based on simple red, yellow and green indicators, vehicles can be processed more efficiently and queuing can be reduced.
As well as improving the vehicle processing workflow, park operators can improve access security based on vehicle license plate recognition technology. Smart cameras can also be used to monitor the speed of vehicles entering the logistics park, detect illegal parking, and send automated alerts to security teams when rules are breached.
Access Monitoring
Through intelligent equipment such as face recognition and AI cameras, the people entering and leaving the park are monitored, identified, tracked, and analyzed to obtain real-time data on the flow of people in the area, and provide accurate traffic statistics and behaviour analysis data for the park operation and maintenance personnel.
HT offer various kind of UI component, such as line chart, bar chart, pie chart etc to display data in an intuitive way and empower operators to maximum efficiency.
Warehouse Management Visualization
HT powerful rendering engine ensures smooth loading and the capability of handles up to 2 million faces 3d models. In this demo, we photorealistic modelling an AS/RS(Automated Storage and Retrieval System) warehouse. Each box inside the shelf is interactive and able to fetch information such as cargo location, real-time trajectory, equipment status, and inventory data.

In addition, models such as warehouse shelf, stacker, conveyor, unstacking machine, AGVs (Autonomous Guided Vehicles), stackers, robotic arms and other equipment are all interactive and able to be triggered to show it’s operating status. When the system received an equipment alarm, the related equipment in the 3d scene will pop up with alert information to inform the operators.
AGVs (Autonomous Guided Vehicles)
AGVs are material handling systems or load carriers that travel autonomously throughout a warehouse, distribution centre, or manufacturing facility, without an onboard operator or driver. AGVs can send the current position and status to the host computer through the wireless network. The host computer updates the database according to the current status and simultaneously accesses the HT visualization system to display the path in real-time. The AVG walking path can also be set according to project requirements.
palletizing robot
The palletizing robot completes various rotations, movements or compound actions through the mechanical arm to achieve prescribed actions and change the position and posture of the grasped objects. In this demo, we can see how HT’s powerful rendering engine achieve precise control of the entire palletizing robot operation process, and highly simulate the swing process of the robot arm.
cargo elevator

The cargo elevator plays an essential role in conveying, lifting, and assisting in loading and unloading materials in storage and transportation. Integrate the robot system, the visualization system allow to display of machine equipment information such as equipment code, task code, hoist current level, equipment status, equipment next maintenance time and other basic information. It is convenient for operators to control and maintain.

Warehouses are expected to play a key role in increasing customer satisfaction, effectively predicting product demand, and making better use of the resources at hand. As a result, the demand for forecasting and accurate decision making is on the rise.
Predictive analytics make use of statistical techniques such as predictive modelling, big data, and data mining to analyze historical trends and make predictions about the future.
Predictive analytics, together with artificial intelligence (AI), can be very effective for recommending optimized inventory levels, replenishing inventory, and increasing operational efficiency as well as warehouse optimization as a whole.
Conclusion
With the advent of always-on e-commerce, the demand for faster responses, and the need to manage a larger number of SKUs with fewer errors, warehouses need to scale up and meet the standards of an intelligent, efficient, and automated warehouse. Hightopo offers the ultimate WMS visualization solution to the warehousing & logistics industry.
Hightopo is dedicated to handling the technical difficulties in the last phase of the data processing procedure in the IIoT: data visualization. Hightopo provides a visualization solution for the real-time monitoring systems by a powerful web-based 2D and 3D graphics rendering engine. It has launched a proprietary software application named HT for Web and continuously strives to make HT for Web one of the top software applications worldwide. HT for Web has been applied in various industries, such as telecommunications, electricity, hydropower, transportation, petrochemical, manufacturing, medical, and industrial control industries.