Digital Twin in the Electric Utilities Industry — 3D Visualization Electric Substation
As the core component of the power grid, the emergence of smart substations has changed the traditional substation operation and maintenance mode. Utilizing the digital twin 3D model and visualize the data in real-time or historically, digital transformation is becoming a standard rather than an exception by now.
In the power sector alone, getting enough data is a small part of the problem: getting the right data and knowing what to do with it is the biggest challenge. The electrical network digital twin is the core enabler for the decarbonization and decentralization of power infrastructures. Digitalization drives further development, as the consistent use of digital models and data opens numerous new opportunities, such as new service offerings and efficient grid operation with networked assets.
In this article, we illustrate the digital twin visualization system for a 500kV electrical substation by the Hightopo 3D Visualization solution. Build 3D models lightweight, establish dynamic digital substation, and get a multi-dimensional presentation of substation operation and maintenance scenarios. Enable real-time monitoring of substation operation status, and interconnection of operation and maintenance equipment, control systems, and information systems. Strengthen the full-state perception and control of substation equipment, enhance the ability to guarantee safe production in substations, and improve the level of lean management of operation and inspection.
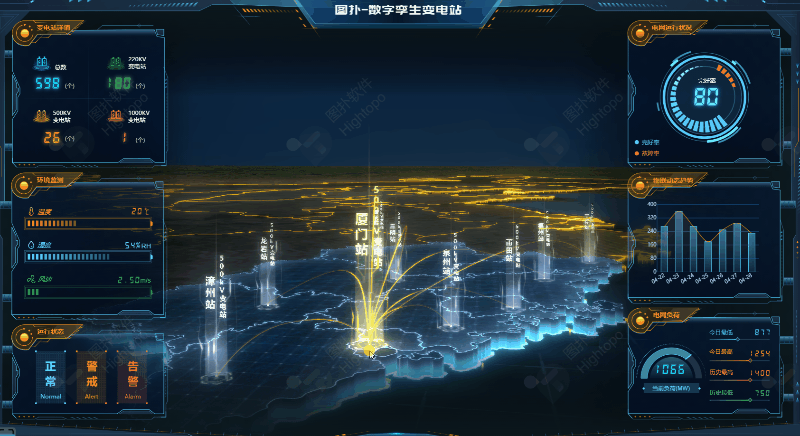
Integrated GIS for Spatial Information
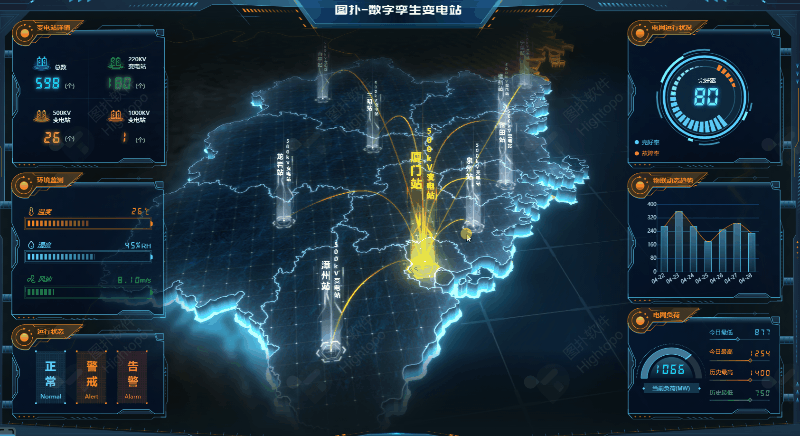
There are thousands of substations across a province, it is obviously impractical to use manual placement to illustrate each substation location. By integrated with Geographic Information System(GIS) to display rich spatial data, algorithms will be used to convert latitude and longitude coordinates into plane coordinates to dynamically generate substations location. The advantage of using GIS is that you can load more map details in Levels of Detail (LOD), and you can directly and accurately get the specific location of each substation.
Lightweight 3D Models
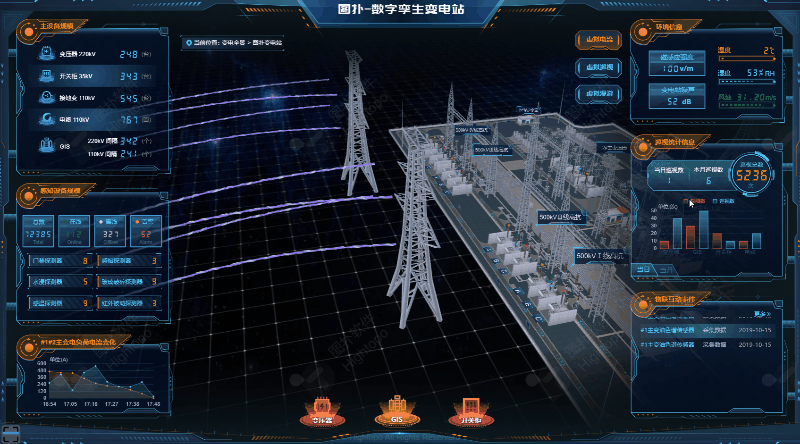
Hightopo Visualization is a web-based solution, considering the loading speed on a web browser, we recommend models total faces under three million. The lightweight 3D modelling technology is used to restore the appearance of infrastructures based on a CAD map, aerial view, and three-view drawing of the equipment at the substation site, which can be zoomed, panned, and rotated, and each device in the scene can respond to interactive events.
Monitoring & Management
Visualize multi-sourced data on 2D pannel through interactive bar chart, line chart, tables, etc. Data collection from generators, substations, microgrids, and industrial and building loads can be combined with many other data sources to inform grid operators about the overall situation. This real-time data can be integrated into GIS along with weather and smart meter data. Breaking down the data silos.
When the devices monitoring sensor detects unusual actives, for instance, reach the threshold, the backstage pushes the status parameters to the forestage, and the forestage shows the corresponding device icon in the position according to the status parameters. Combine with artificial intelligence analysis and other technologies to analyze historical and real-time data for predictive & prescriptive maintenance and operation.
Visualization of Electricity Flow
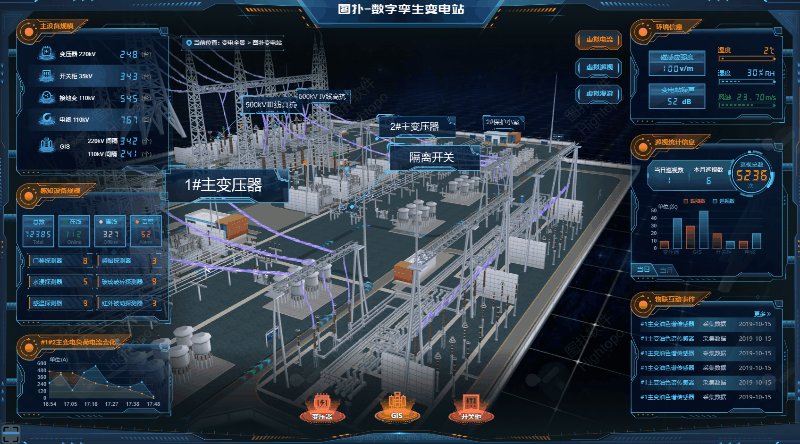
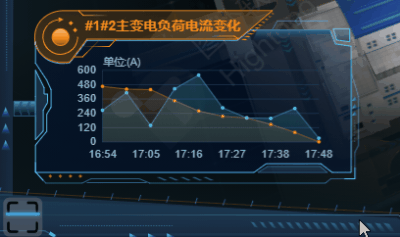
Through 3D visualization technology, display all the loop directions of voltage transformer and current transformer power supply, combined with scientific and technological sense elements to simulate the current flow, archiving the monitoring, measurement, control and adjustment for primary equipment (transformers, circuit breakers, isolating switches, etc.)
Heatmap(Thermal Map) Visualization
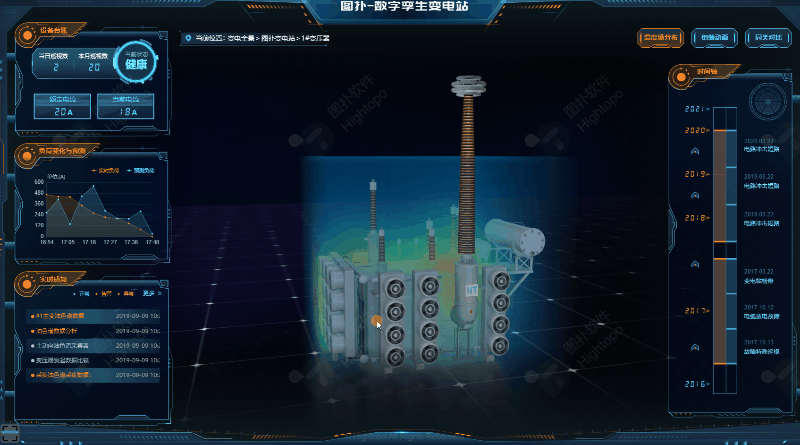
Utilizing a 3d heatmap to illustrate real-time data source from the temperature and humidity sensor in the transformer. The real-time temperature data of the current position can be displayed when the mouse is hovering over the position, which can more quickly and accurately locate the specific transformer component for the unusual overheat, timely response measures should be taken to efficiently solve or avoid uncontrollable problems.
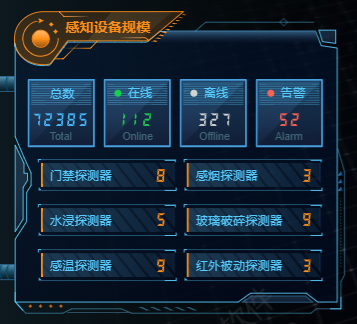
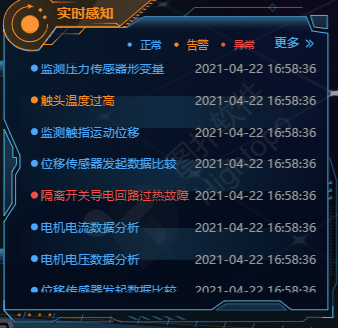
Real-time Monitoring of Perception Data
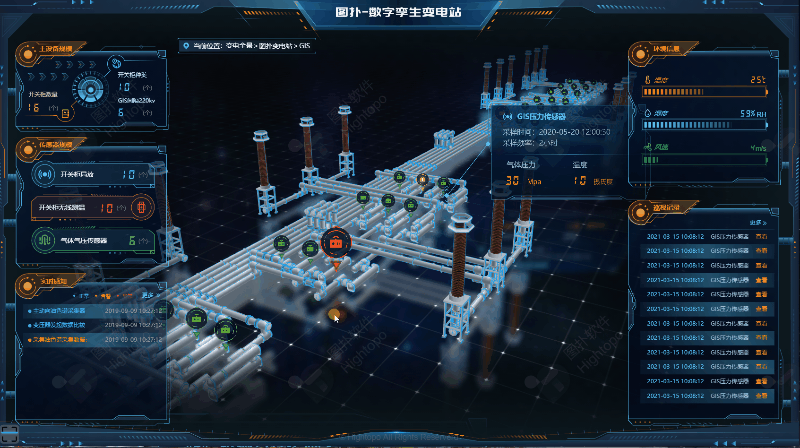
Each type of sensor distributes points according to the actual installation position, and identifies the online monitoring points of primary equipment one by one. The sensor status of each point has a corresponding display effect, e.g. warnings status marked in red, and abnormalities status in a red flashing. When the mouse is over the sensor point, the real-time status information panel will be displayed. When the sensor point is clicked, it will show its detailed list to view the historical data and trend curve of the sensor. At the same time, you can conveniently switch to query historical sensor data and trend curves in other locations according to the menu.
Robot Inspection
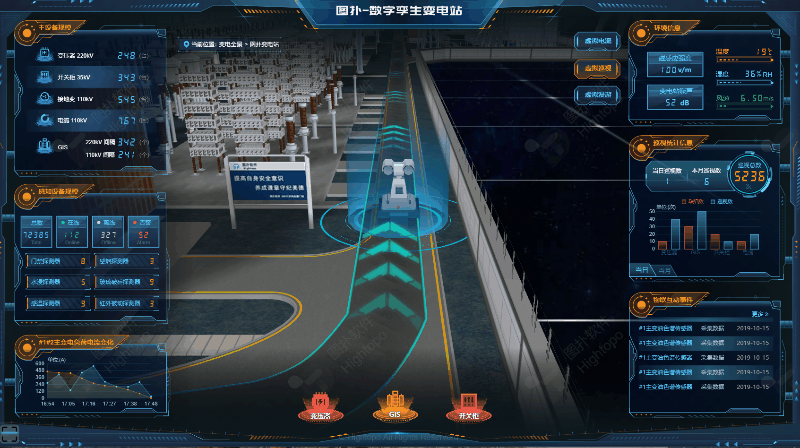
Daily maintenance of substations requires a large number of inspectors to inspect the equipment, which is not only inefficient but also very dangerous, and severe weather such as high temperature, heavy rain, and heavy fog frequently occurs, which brings many obstacles to manual inspections. The intelligent inspection system that cooperates with outdoor inspection robots replaces manual inspections for autonomous monitoring. Through the intelligent inspection system, the alarm information is issued according to the alarm equipment, and the target location can be reached at the first time, and the inspection video and alarm information can be viewed in real-time. The staff can know in time and make a corresponding response. The use of robot inspection not only improves work efficiency, reduces the labour intensity of operation and maintenance personnel, and reduces operation and maintenance costs, but also effectively improves the safety monitoring and management of unattended substations.
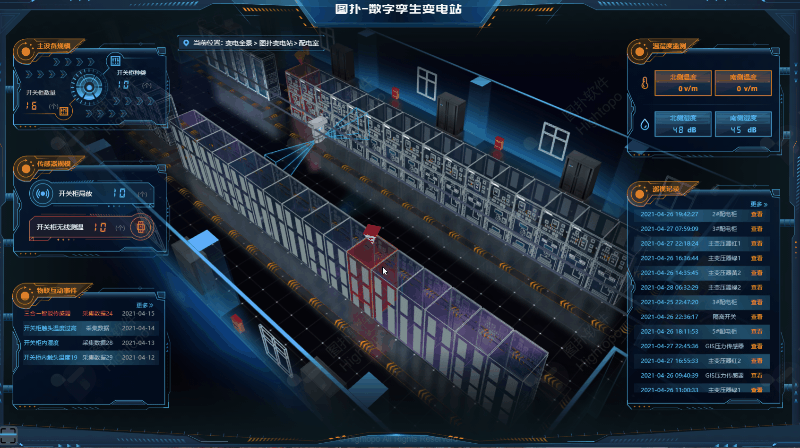
Workforce Safety — Personnel Positioning
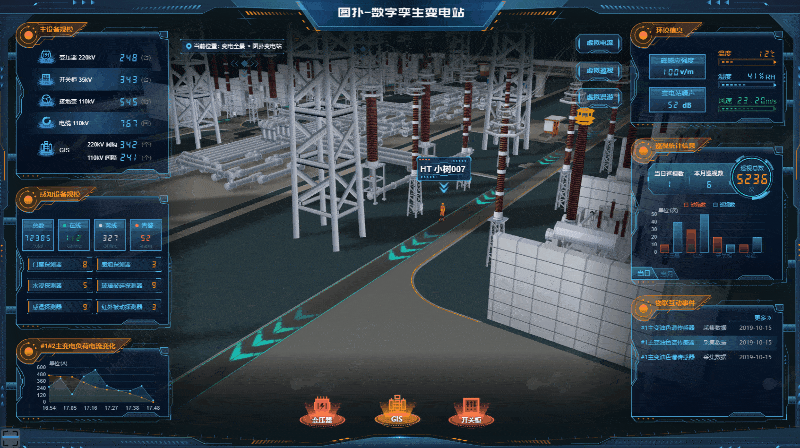
Track the position of the staff in real-time, and mark the position in the 3D scene according to the position information returned from backstage to monitoring the position of staff. According to the safe operation area(protective fence in the 3D scene) in the system, combined with the staff’s positioning information, to know whether they are working in the safe area, and if they exceed the safe area to a dangerous area by mistake, a safety alarm is issued to the operator.
Web SCADA
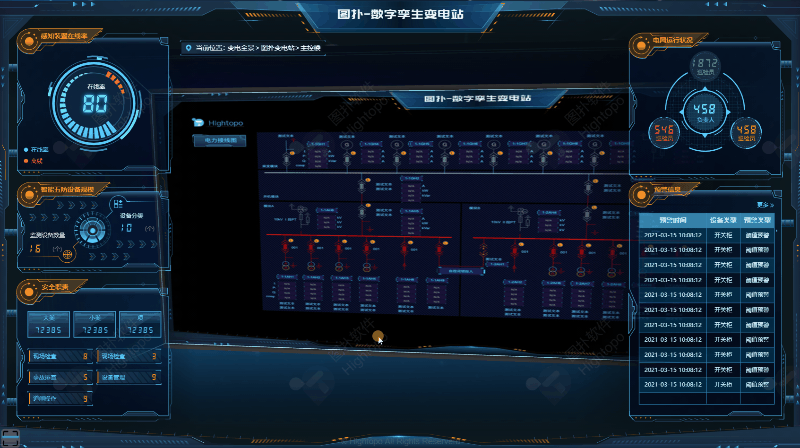
The power wiring diagram of the primary equipment of the substation displayed on the large screen of the main control room, the 2D configuration diagram drawn by the HT technology, can also be upgraded to a 3D configuration diagram, which is more impressive. The voltage and current in and out of the substation and the status of each primary device are displayed in the form of the 3D diagram, 3D animation so that the connection relationship is easy for the public to understand, even for those non-professionals individuals.
Industry Training
Training grid operators along with grid control staff on a dynamic digital twin replica with realistic scenarios mean that when serious faults occur, grid control centre staff will know how to work together as a coordinated team, and which generators and loads could help them avoid outages to maintain a comfortable margin of operational flexibility.
Transformer Assembly Animation
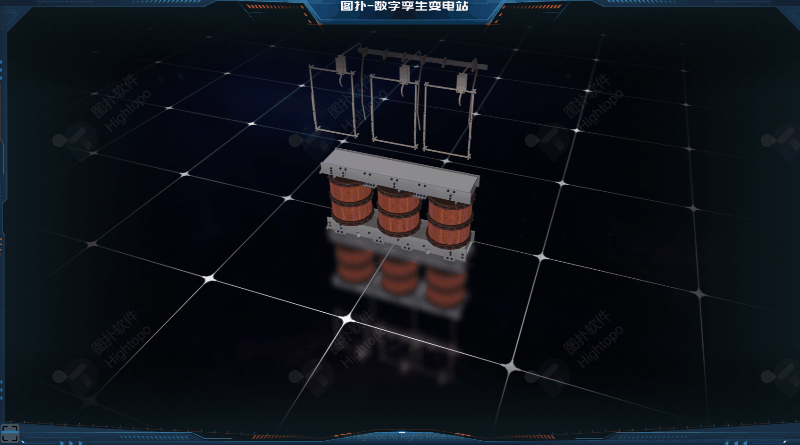
Through 3D virtual simulation of transformer assembly animation, it introduces the working principle and assembly process of transformer equipment, visually displays the composition and installation location of the main components of the transformer, and introduces its main characteristics with text descriptions, which is realistic and technological. This 3D visualization system independently developed by HT can be used as a simulation training material for on-site installation and maintenance of transformers, which can efficiently and conveniently for teaching transformer working principles and new employees training (VR supported).
VR Training
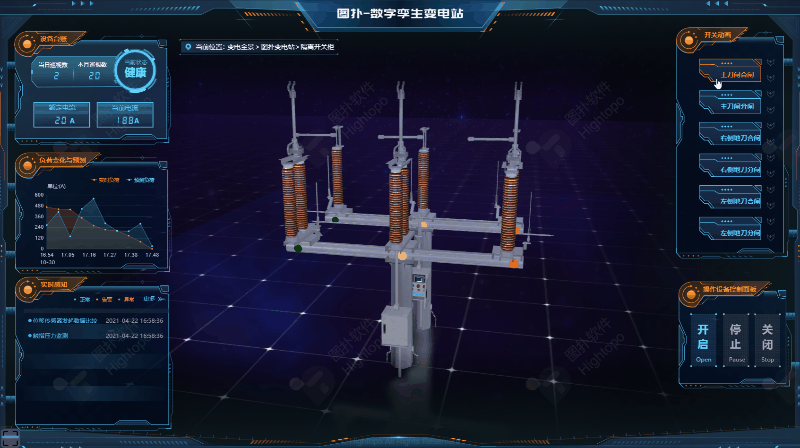
Using HT’s innovative 3D visual modelling techniques to build an interactive environment for isolation switchgear, providing a comprehensive and practical training experience, and better solving the many difficulties and problems faced by professional large-scale complex equipment in employee training. By controlling the operating panel of the isolation switch operating mechanism, the main knife gate, the left floor knife, the right floor knife and other components, staff can intuitively operate the equipment, understand its operation principle, and truly realize 3D interactive simulation demonstration training.
Mobility
Hightopo 3D visualization solution supports cross-platform browsing, which can be viewed by any mobile terminal. Even the operation and maintenance personnel who are not at the work station can also monitor through mobile phones or iPads. This not only reducing material and labour costs but also Improve workforce safety. Mobility is essential for edge grid site which likely has few or no staff on-site.
Conclusion
By transforming unstructured information into a smart digital asset, plant and grid operators are empowered to visualize, build, and manage power systems, sub-stations and facilities of all complexities, ensuring safe and efficient operation throughout the entire life cycle. By using electric network digital twin, utilities are able to shape the operations and maintenance strategies of the future.
Hightopo HT for Web visualization solution increasing asset adaptability and maintaining system reliability while reducing material and labour costs in a critical balancing act and reality for many substation managers. H1elp to gain actionable intelligence and unlock new values of your substation data.