Tomochain coin is a native cryptocurrency of the Tomochain blockchain created on the Tomochain network. As a native coin of the tomochain network,tomochain coin can easily be sent from one peer to another after without involvement of a third party entity like the centralized government. The tomochain coin will be received to the second peer party after being verified by the different nodes running the tomochain network.This will only happen after the sender of tomochain coin has paid a certain amount of transaction fees which will be shared among the nodes validators.Tomochain coin is a delegated proof of stake coin .As a delegated proof of stake coin,tomochain coin can be used by different delegators to vote their coin to the verified tomochain nodes.The verified tomochain nodes will use the votes to secure the tomochain network as well as to validate any transaction taking place on the tomochain network thus in return they receive reward which they will distribute to delegators based on their votes amount. The more the voting power the more reward to be received.In Tomochain network, different developers can create their Dapps.In order for their Dapps to continue running on the tomochain network,they will be required to use the tomochain coin to pay for the Dapp hosting fees. Different Dapps on the tomochain network can also use the tomochain coin to create and issue the tokens of their Dapps on the tomochain network.In order for those tokens to be sent from one smart contract address to another,one peer will be required to use the tomochain coin to pay for the transaction fees so that the transaction of the block ofthose tokens can be added to the tomochain blockchain by different nodes running the network.In march 2018, tomochain conducted its ICO. 100 million coins were created. Out of this 100 million coins, 40 million coins were issued for sale at a price of $0.25 per tomochain coin.One month later,that is in April 2018,the price went as high as $2.2 thus profiting those investors who had taken part in its ICO sale and were holding tomochain coin by that time.Towards the end of 2018,the price of one tomochain coin went again as low as $0.29 thus causing many investors to purchase again.In the beginning of 2019 the price started trading again at $0.27 and has managed to maintain this higher price and is currently trading at above $0.37.This stable price of tomochain coin is due to several factors such as Dapps built on its blockchain network,its liquidity and the consensus used.Dapps built on tomochain network is affecting the price of tomochain coin as follows;
Dapps built on tomochain network
Since the launch of tomochain coin and its native blockchain,the tomochain network,its price has been seen to perform well overtime. During its launch in 2018 when an ICO was conducted,one tomochain coin was going for $0.25. The price rises by over 900% to $2.2 but later dropped to $0.27. Currently,one tomochain coin is trading at a range of $0.27 to $0.4. This stability increase in price has been due to an increase in the number of developers to create their Dapps on the tomochain network.In the near future,if more developers will continue to join tomochain to develop over there then its utility function will incline thus causing its price to incline as well while if the number of developers exit the platform for other platform then its utility function will decline thus causing its price to decline as well.Here are some of the Dapps on the tomochain network affecting the price of tomochain coin;
a.Tomomaster
Tomomaster is a delegated staking platform where different delegates can come and vote for a verified nodes to run the tomochain network.As more users are coming to tomomaster to delegate their votes to a verified node to run the network,the tomochain coin will become inefficiency thus causing its price to increase while if more delegators are exiting the tomomaster platform because of a decline in reward,then tomochain coin will become in surplus thus causing its price to decline.Can visit the platform from below;
https://master.tomochain.com/
b.Maxbet
Maxbet is a gambling platform where users can bet using tomochain coin.In the near future,if more users join Maxbet to gamble over there using the tomochain coin,then its utility function will increase thus causing its price to increase while if more users exit the maxbet for other blockchain gambling platform,then the utility function of tomochain coin will decline thus causing its price to also decline.To gamble on maxbet using the tomochain coin,you can visit the platform from below;
https://maxbet.pigfarm.io/
c.Tomoswap
Tomoswap is a tomochain swap for instantly converting the tokens issued and created on tomochain network back to tomochain coin and back to the respective native tokens.As more tokens are being issued and created on the tomochain network,then the tomochain coin utility function will increase since more Dapps will be swapping their tokens to tomochain coin and back thus causing the price of tomochain to stabilize by increasing in value.On the other hand, as more Dapps tokens are exiting the tomochain network for other platforms,then the tomochain coin utility function will decline thus the tomoswap usage will decline thus causing the price of tomochain coin to decline.You can start swapping the tokens created and issued on tomochain platform on tomoswap from below
https://tomoswap.com/
d .Tomobird
This is a tomochain gaming platform that rewards users with tomochain coin for playing the tomobird game. As more users continue to join the tomobird platform to play games over there,the utility function of tomochain coin will increase thus causing its price to also increase.On the other hand, if the number of users playing the tomobird game decline,then the utility function of tomochain coin will decline thus causing its price to decline.You can join the tomobird players to receive reward in form of tomochain coin from below;
https://tomobird.tokenplay.net/
Furthermore,the future market price for tomochain coin based on bullish and bearish condition can further be explained as follows;
In a bullish market condition, tomochain coin will be trending in an upward market direction. When tomochain held its ICO, one tomochain coin was going for $0.25. In a very short period of time, the price managed to go as high as $2.2 but later dropped to $0.27. Since then the price has maintained at a range of between $0.27 to $0.4. The increase in the price of tomochain coin has been as a result of an increase in the number of developers on the tomochain network thus resulting to an increase in the number of Dapps on the tomochain network.In the near future,if more developers join the tomochain platform to develop their Dapps over there as well as to issue and create the tokens of their Dapps on the tomochain network then tomochain coin will increase its utility function thus causing its price to increase much further.The future price analysis of tomochain coin due to an increase in the number of Dapps built on its platform is indicated from below;

From the candlesticks chart analysis of the tomochain above, there are two points,point A and point B. Before point A, the tomochain market can be seen trending upward and manage to go as high as $0.355. This increase in price is due to an increase in the number of developers joining the tomochain platform to develop their Dapps over there due to an increase in the monetization of their Dapps over there.Some developers as well as users of those Dapps on the tomochain network then dump their earned tomochain coin in several exchanges including at the tomoswap thus causing the price of tomochain to decline to point A at $0.345. More developers then join the network and then purchase the tomochain coin in several exchanges to pay for the Dapps hosted there as well as to create and issue the tokens of their Dapps thus causing the price to increase further to point B. In one year time, if more developers will continue to join the tomochain platform, then the tomochain coin will further increase its utility function thus causing its price to increase further to over $0.45. As an investor,this is the right time to purchase tomochain coin since it has a bright future.
In a bearish market condition, tomochain coin will be trending in a downward market direction. When tomochain held its ICO, one tomochain coin was going for $0.25. In a very short period of time, the price managed to go as high as $2.2 but later dropped to $0.27. Since then the price has maintained at a range of between $0.27 to $0.4. The increase in the price of tomochain coin has been as a result of an increase in the number of developers on the tomochain network thus resulting to an increase in the number of Dapps on the tomochain network.In the near future,if more developers already building on the platform exit the tomochain platform and shift to other platforms due to unfavorable conditions such as high fees charged and decline in the revenue of their Dapps , then tomochain coin will decline in its utility function thus causing its price to decline much further.The future price analysis of tomochain coin due to a decline in the number of Dapps built on its platform is indicated from below;
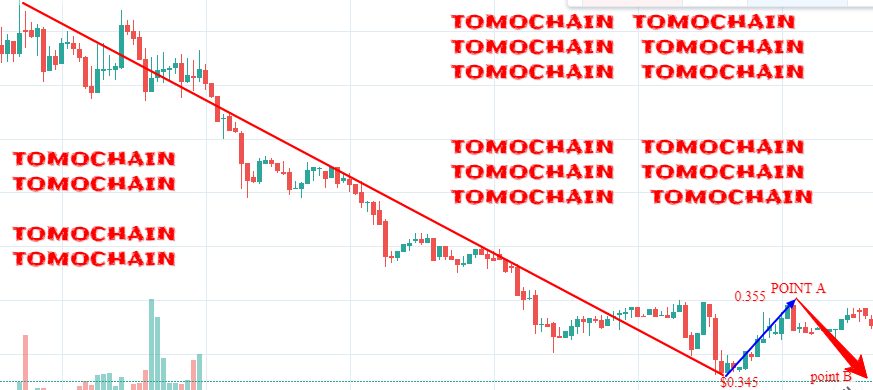
From the candlesticks chart analysis of the tomochain above, there are two points,point A and point B. Before point A, the tomochain market can be seen trending downwards and manage to go as low as $0.345. This decrease in price is due to a decrease in the number of developers on the tomochain platform due to unfavorable conditions such as decline in revenue of their Dapps as well as increase in the transaction cost on the tomochain network.Some developers as well as users of those Dapps on the tomochain network then purchase some tomochain in several exchanges including at the tomoswap so that they can use the coin to perform several functions such as paying for transaction cost and paying for their Dapps thus causing the price of tomochain to increase to point A at $0.355. More developers then exit the network and shift to other network due to an increase in unfavorable condition thus causing the price to decline further to point B. In one year time, if more developers will continue to exit the tomochain platform, then the tomochain coin will further decline in its utility function thus causing its price to decline further to below $0.25. As an investor,this is the right time to sell tomochain coin if you feel it does not have great potential of mass adoption by developers.
Tomochain coin has been performing well in the market. During its ICO, it was sold at $0.25 but the price went as high as $2.2 for only one month but later declined to $0.27. Currently,the price is ranging between $0.27 to $0.4. This stability in price is due to more developers joining to develop in the platform. In years to come, if more developers join the platform, the price will increase further while if more developers exit the platform then the price will decline further.
You are always free to support our work from below;
skrill donation:mudigoomondi@gmail.com
Neteller donation:mudigoomondi@gmail.com
Bitcoin:3AFeiwUp6erj2iRBmdsnc7YhC7gcYVD6oj
Ethereum; 0x346570c491b76c7cd51699bdd272762111b743a9
Litecoin: LeEH7B82ccXJ6QoibCryGJNpDGNx2x77fL
Dogecoin: DLShs2vqhMc1ggqo8MPPMBTcPAZdqCZoWd
lightning network:tipping.me:https://tippin.me/@quintomudigo