quintomudigo

Trader, blockchain technologist and contentpreneur

Zilliqa is a native cryptocurrency of the zilliqa network that can be transferred from one smart contract address to another without involvement of a third party thus making it a decentralized utility coin. The transaction will be processed to the second party after the block is being added to the zilliqa network by the miners running the zilliqa network. The miners will verify the transaction after a given transaction fee has been paid by that smart smart contract address sending the zilliqa coin to another smart contract address. Since zilliqa coin is a proof of work coin,different individual who want to take part in releasing the new coin the the mining process can share their GPU power to the zilliqa mining pool after which they will be able to receive their new zilliqa reward mined based on the amount of computing GPU shared. The more their computing GPU power shared the more reward they will receive. Also,since zilliqa network can enable developers to build Dapps over there,then they can use zilliqa coin to pay for their Dapps over the zilliqa network as well as to issue the tokens of their Dapps on the zilliqa network. One individual wanting to transfer the created and issued token on the zilliqa network can use the zilliqa coin to pay for the gas fee so that the transaction can be initiated on the zilliqa network by the miners running the network.

Zilliqa coin transaction 

Zilliqa coin transaction takes place on the Zilliqa blockchain explorer based on block height and timestamp.Initially,the transaction was taking place on the ethereum network but upon migration to its mainnet on the Q1 of 2019,the transaction takes place over there. Here is a view of the transaction of Zilliqa on the zilliqa network;

To view how the transaction takes place on the Zilliqa  blockchain, you can follow the link below;

https://viewblock.io/zilliqa/blocks  

Date Launched

Zilliqa coin project was launched in June 2017 with the main objective of solving the scalability issue thus making it to adopt the sharding technology. It was also created to enable developers to create their Dapps on the Zilliqa network.

.

Founder Of Zilliqa  coin

Zilliqa coin project was created by a group of computer scientist with the main objective of solving the scalability issues experienced in other network such as ethereum and bitcoin. Some of the team members behind the Zilliqa coin project are: Amrit Kumar, Prateek Saxena and Kenneth Bok.

Process of creating Zilliqa coin

In 2017 when Zilliqa coin was launched,60% of it were created through the token generation event. The remaining 40% which account for 8.4 billion coins will be released through the mining process since zilliqa coin is a proof of work coin. Miners and mining pool are key players in the zilliqa mining process. In the Zilliqa mining process,the algorithm used is Ethash algorithm. The miners can choose to become solo miners which is less rewarding or they can choose to join a zilliqa mining pool which is more rewarding.As a pool miner,the more GPU computing power you share the more reward you will receive.Here is how the zilliqa mining process looks like;

If you would like to take part in sharing your GPU power so that it can be used to secure the zilliqa network as well as to add new block to the zilliqa network then in return you receive reward in form of new zilliqa coin minted then you can join from below;

https://pool.zil.farm/  

Maximum circulation of Zilliqa coin

The maximum amount of Zilliqa coin that should be circulating in the Zilliqa network should be 21 billion coins according to the Zilliqa blog. Out of this amount, 6.3 billion coins will be distributed to early community members after token generation even of 60% of 21 billion coins has taken place. Another 6.3 billion coins will be distributed to the zilliqa company, zilliqa team member and zilliqa agencies for a period of 3 years after the token generation event has taken place. The remaining 8.4 billion coins will be released through mining process and will be rewarded to those who will take part in sharing the GPU computing power to secure the network and to and to add new block to the network for a period of 10 years. Here is how the supply distribution of Zilliqa coin looks like;

Zilliqa coin  Price

Currently, 1 Zilliqa  coin is worth more than $0.00458 and its price is expected to increase over the next period of time due to its increase in its utility function. Zilliqa coin is being abbreviated as  ZIL.

Converting my Zilliqa coin  to other cryptocurrencies

To convert your Zilliqa coin to other cryptocurrencies such as bitcoin and Ethereum, you need to have a cryptocurrency exchange account. If you don't own one then you can follow the link to open a cryptocurrency exchange account for easy conversion of your Zilliqa coin to Bitcoin or Ethereum. Here are some of the exchanges where you can easily exchange your Zilliqa to your favorite cryptocurrency;

https://www.coinex.com/ 

https://www.binance.com/en 

 https://www.gate.io/

https://www.kucoin.com/  

https://global.bittrex.com/ 

 https://hitbtc.com/

https://www.digifinex.com/ 

 https://www.bitmart.com/

https://www.hotbit.io/ 

 https://www.bitfinex.com/

Storing my Zilliqa coin

To store your Zilliqa coin, you need a zilliqa wallet compatible to zilliqa mainnet. You can either store online or offline. To store your zilliqa coin online, you can either use https://dev-wallet.zilliqa.com/ wallet or can use other third party wallet providers like the coinpayment. To securely store your Zilliqa coin offline from being stolen by hackers, you can use ledger Nano wallet.

Transferring my  Zilliqa coin to other Users

If you want to transfer your Zilliqa coin to another user, the two of you must have trust in each other. The trust should be the Zilliqa coin address provided for by the receiver while the sender must have the Zilliqa coin balance in their account to send to the receiver. For the sender, a blank space to insert the receiver address and another blank space to insert the amount to send to the receiver is indicated. Here is how it looks like;

Knowing more About Zilliqa coin

If you feel that you need to learn more about Zilliqa coin project, then you can follow them on their site. Here is the link redirecting you to Zilliqa coin platform website 

https://zilliqa.com/  

You can as well read their white paper to learn more about their idea from below

https://docs.zilliqa.com/whitepaper.pdf  

You can also join as a community member in any of their social media platform from below to follow the discussion made by other community members;

twitter:https://twitter.com/zilliqa

reddit:https://www.reddit.com/r/zilliqa/

telegram:https://t.me/zilliqachat

Now that you know, I think that it is time for you to start earning some zilliqa  coin through mining by simply sharing your GPU  to a zilliqa mining pool so that they can use your GPU computing power to secure the network and to add new block to the zilliqa network. The more GPU power you share the more zilliqa coin you earn .If you feel that we should also own some zilliqa for simply helping you know about it then here is our zilliqa address:

zil105ret65x8e7y9jnw0c7849w9lg25eqe6fa3qhp

Force index is an oscillator indicator.

Being an oscillator indicator, Force index indicator was created by Alexander Elder to help traders measure the power of bull market whenever the price increases and the power of bear market whenever the price decreases.

According to Alexander Elder,Force index indicator is based on three key components,that is;

-Direction of price change

-The extent of price change

-And the trading volume

Furthermore, the values of Force index indicator is best approximated with the help of moving average as follows;

-By subtracting yesterday close price by today's close price and then multiplying the result by today's volume.This is indicated as below;

FORCE INDEX= V|*(CCURRENT-CPREVIOUS) where as;

V is volume,C is closing price ,current is today's close price and previous is yesterday's close price.

If closing price are higher today than yesterday then the force is positive while if closing price are lower today than yesterday then the force is negative.

1. Force Index Oversold market

 Just like in other indicators,Force index indicator has an oscillator at point 0.0 in which when the force index crosses above 0.0 then the index becomes positive while when it crosses below 0.0 then the index becomes negative.

When force index is below 0.0 and the period of indicator is inclining,then that is an indicator that the market will move upwards thus the cryptocurrency trader should place a buy order of a given amount of cryptocurrency in terms of USDT if they have a USDT balance in their account since the market of the cryptocurrency they want to purchase will start moving upwards.The cryptocurrency trader can either place a market buy order which will be executed instantly or they can place a buy limit order which will be executed when the market reaches their buy limit price.The cryptocurrency trader should place their buy order with risk management. This is indicated as from below;

From the candlesticks chart above,there are two points,point A and point B. The market represents the TRX market in terms of USDT. At point A, there are two adjoining arrows thus it is the force index indicator. On the other hand at point B, the force index has fallen below 0.00 and at the same time the period of the force index is increasing over there thus an indication of an oversold market over there. This will signals the cryptocurrency trader to buy a given amount of TRX using the USDT balance in their since the market is starting to move upward.The cryptocurrency trader can either place a buy market order which will be executed instantly or they can place a limit buy order which will be executed when the market reaches their limit buy order. When the market starts moving upward,then the account of the cryptocurrency trader will start increasing in value in terms of USDT.

2.Force Index overbought market

Just like in other indicators,Force index indicator has an oscillator at point 0.0 in which when the force index crosses above 0.0 then the index becomes positive while when it crosses below 0.0 then the index becomes negative.When force index is above 0.0 and the period of indicator is decreasing,then that is an indicator that the market will move downwards thus the cryptocurrency trader should sell the amount of TRX which he had previously purchased and is currently holding to avoid their account declining in value. The cryptocurrency trader can either place a market sell order which will be executed instantly or they can place a sell limit order which will be executed when the market triggers their sell limit order price.When their sell order is being executed,their account will increase in value in terms of USDT. This is indicated as from the candlesticks chart below;

From the candlesticks chart above,there are two points,point A and point B. The market represents the TRX market in terms of USDT. At point A, there are two adjoining arrows thus it is the force index indicator. On the other hand at point B, the force index has risen above  0.00 and at the same time the period of the force index is decreasing over there thus an indication of an overbought market over there. This will signals the cryptocurrency trader to sell the amount of TRX which he had previously purchased and is currently holding to avoid making their cryptocurrency account to decline in value.The cryptocurrency trader can either place a market sell limit order which will be executed instantly or they can place a sell limit order which will be executed when the market price reaches their sell limit order price.

Recommendation: Cryptocurrency market is highly volatile. When you place a buy order, make sure to apply risk management to be safer incase your buy order goes against you.

You are always free to support our work from below;

skrill donation:mudigoomondi@gmail.com

Neteller donation:mudigoomondi@gmail.com

Bitcoin:3AFeiwUp6erj2iRBmdsnc7YhC7gcYVD6oj

 Ethereum; 0x346570c491b76c7cd51699bdd272762111b743a9

Litecoin: LeEH7B82ccXJ6QoibCryGJNpDGNx2x77fL

 Dogecoin: DLShs2vqhMc1ggqo8MPPMBTcPAZdqCZoWd

 lightning network:tipping.me:https://tippin.me/@quintomudigo

 wave is a native cryptocurrency of the wave platform created on the wave blockchain and whose transaction can take place from one smart contract address to another upon being verified by the nodes running the wave platform network. Because of this,wave coin is being considered as a decentralized asset. On the wave platform,different developers can be able to create their Dapps and use wave coin to pay for hosting them there. The Dapps owner can also create and issue the tokens of their Dapps on the wave platform using the wave coin. With the wave coin, one use it to pay for gas fee in order to transfer their wave balance from one smart contract address to another. Dapp users on the wave platform can also use the wave coin to pay for gas fee while transferring their earned token from one smart contract address to another. Since wave coin is a delegated proof of stake coin, different users who want to earn the staking reward can use their coin to vote the nodes who will use those coins to secure the wave network as well as to validate any transaction taking place on the wave network. In 2016,wave conducted its ICO where one wave coin was going for $0.19. One year and some months later,one wave coin had gone as high as $16 thus profiting those early investors who were holding the coin by that time. Currently,one wave coin is trading at a range of above $0.69 to $0.715. The increase in price overtime has been due to an increase in its adoption thus making its liquidity to increase.The liquidity of wave affecting its price movement is further being explained as follows;

  Liquidity of wave coin   

Wave coin is highly liquidity when it is highly decentralized and less liquidity when it is highly centralized.Being decentralized means that it is being listed in several exchanges thus no single party is controlling most of it thus its price being determined by those trading it in those exchanges.On the other hand,being centralized means most of it is based on its blockchain or on a single smart contract address thus becomes difficult to move its price upward. Since wave coin is highly liquidity,here are some of the exchanges that is making it to be highly liquidity thus stabilizing its price;

a. binance

  Binance is a Malta based cryptocurrency exchange with a daily 24 hour volume of over $1 billion. In binance exchange,wave coin is listed in terms of bitcoin ,in terms of binance coin,in terms of Ethereum and in terms of USDT. Being abbreviated the pairs become Wave/BTC, Wave/USDT, Wave/BNB and Wave/ETH. In terms of BTC, wave has a daily trading volume of over 68 BTC while in terms of USDT, it has a daily trading volume of over $290,000. In terms of BNB, it has a daily trading volume of over 780 BNB while in terms of Ether, it has a daily trading volume of over 160 Ether. This shows that it is highly bought and sold at the binance exchange. If the same is happening to it in several exchanges where it is being listed,then it is making it to be highly liquidity thus stabilizing its price.Because of this,its price can slightly move upward or downward. Since the explanation is almost the same,we will not explain other exchanges where wave coin is listed but we will instead list them. Here are some of other exchanges where wave coin is being listed thus making its liquidity to be very high;

b. upbit

c.  bittrex

d.  kraken

e.  exmo

f.  hitbtc

g.  bitmart

h.  huobi global

i.   coinex

j.   okex

k.  wave platform

The listed exchanges above affects the bullish and bearish market movement of the wave coin. The bullish and bearish market for wave coin based on its liquidity can further be explained as follows  

1. Wave bullish market based on its liquidity

  In bullish market condition,wave coin moves in an upward market direction. Wave coin has been performing well since it conducted its ICO in 2016. The price managed to go as high as $16 from its lower ICO price of $0.19. The price then falls down and is currently trading at a range of between $0.6 to $0.75. The increase in price has been due to an increase in the number of exchanges in the crypto space where they list the wave coin to their exchange platform thus causing it to become inefficiency in its blockchain thus causing its demand to increase. Because of this its price automatically had to go up.In the near future,if more exchanges will continue to enter the cryptocurrency space and list the wave coin in terms of other trading pairs,then its liquidity will increase further thus causing its price to slightly increase. The price analysis of the wave coin is being indicated as from the candlesticks chart below;      

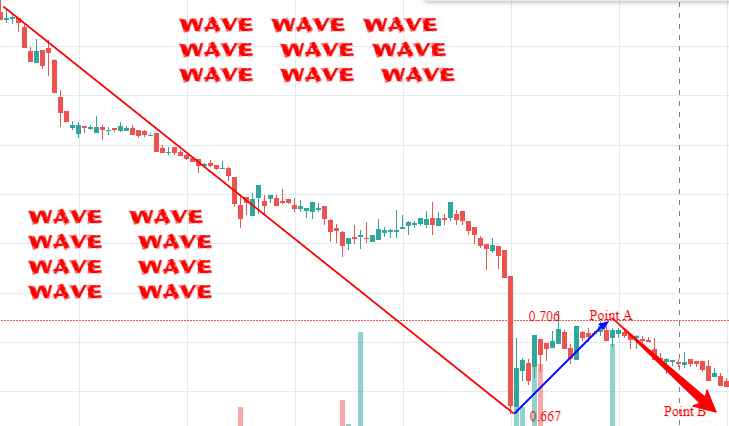
From the price analysis of wave coin above,there are two points,point A and point B. Before point A, wave coin can be seen to have gone as high as $0.706. The increase in the price of wave has been due to the increase in the number of exchanges entering the crypto space to list the wave coin in terms of other pairs in their platform thus easing the Dapp users on the wave platform. Because of this, its demand has increased thus causing the price to increase all the way to $0.706. Some Dapp users whose life has been eased by these exchanges then dump their earned wave coin to several exchanges thus causing the price to slightly drop downwards to point A at $0.667. More cryptocurrencies exchanges which have joined the cryptocurrency space then list the wave coin in their platform thus further increasing its liquidity.Because of this, a demand is being created thus causing the price to increase again to point B . In the near future,if more exchanges joining the cryptocurrency space will continue listing the wave coin to their platform,then its liquidity will continue to increase further thus causing its price to continue increasing further.In one year time from now, there is possibility of the price to go as high as $1 if more exchanges will continue to list the wave coin. This is the right time for investors to purchase the wave coin and hold it.    

2. Wave bearish market based on its liquidity

  In bearish market condition,wave coin moves in a downward market direction. Wave coin has been performing well since it conducted its ICO in 2016. The price managed to go as high as $16 from its lower ICO price of $0.19. The price then falls down and is currently trading at a range of between $0.6 to $0.75. The increase in price has been due to an increase in the number of exchanges in the crypto space where they list the wave coin to their exchange platform thus causing it to become inefficiency in its blockchain thus causing its demand to increase. Because of this its price automatically had to go up.In the near future, if the existing exchanges will start delisting the wave coin in their platform because Dapps will have started leaving the wave platform to go and develop in other blockchain due to high transaction fees charged by wave platform, then its liquidity will decrease.Because of that,wave coin will become in surplus in its blockchain thus causing its price to decrease. The price analysis of wave coin due to a decline in its liquidity is being indicated as from the candlesticks chart below;    

  From the future price analysis of wave coin above,there are two points,point A and point B. Before point A, wave coin can be seen to have gone as low as $0.667. This decrease in price has been due to a decrease in its liquidity due to its increase in its delisting by several exchanges .The delisting from several exchanges is due to many developers exiting to develop on the wave platform due to high transaction fees thus making wave coin daily trading volume to decrease in several exchanges. Few Dapps in the wave platform then purchase the wave coin in few available exchanges thus causing the price to slightly increase to point B at $0.706. More existing exchanges then continue to delist wave coin from their platform thus causing its price to decline further. In the near future,if the wave platform will continue to increase the transaction cost,then it will be like chasing developers away from their platform thus causing many exchanges to continue delisting the coin thus further decreasing the liquidity of wave coin. In one year time, if this is going to happen,then the price can go as low as $0.5    

    Summary

By being highly liquidity,then it means that wave coin is highly decentralized such that no one is in control of most percentage of it while by being less liquidity then it means wave coin is highly centralized thus most of it is being control by few individual. Therefore we can say that being highly liquidity stabilize the price of wave coin while being less liquidity makes the price to be highly volatile. Therefore,we can say that an increase in the liquidity of wave coin will result to an increase in its price while a decrease in the liquidity on the other hand will result to a decrease in its price.  

You are always free to support our work from below;

skrill donation:mudigoomondi@gmail.com

Neteller donation:mudigoomondi@gmail.com

Bitcoin:3AFeiwUp6erj2iRBmdsnc7YhC7gcYVD6oj

Ethereum; 0x346570c491b76c7cd51699bdd272762111b743a9

Litecoin: LeEH7B82ccXJ6QoibCryGJNpDGNx2x77fL

Dogecoin: DLShs2vqhMc1ggqo8MPPMBTcPAZdqCZoWd

lightning network:tipping.me:https://tippin.me/@quintomudigo

Demarket is an oscillator indicator.

As an oscillator indicator,Demarker indicator was created by Thomas Demark with the main objective of measuring the underlying asset thus enabling traders to know whether the market is in an overbought or oversold condition.Demarker therefore has two components ,that is;

Demax which compares the current(bar) high to the previous (bar) high

Demin which compares the current(bar) low to the previous (bar) low

 According to Thomas Demark,the value of the intervals (i) of the two components above is therefore calculated using the following formula;

for Demax we have;

 if High (i)>High(i-1) then we have the following;

Demax(i) = High(i)– High(i-1)

if otherwise then we have

Demax(i)=0

for Demin we have;

if low(i)<low(i-1) then we have the following formula;

Demin(i)= low(i-1) – low(i)

if otherwise then we have;

Demin(i)=0

Oversold cryptocurrency Demarker indicator

Demarker indicator has its intervals oscillation at between 0.3 to 0.7.When the demarker curve is between 0.3 to 0.7,then the cryptocurrency trader is not at any risk while in the market.At that range,the cryptocurrency trader can continue hold the cryptocurrency which he had previously purchased.If the demarker curve falls below 0.3,that is an indicator that the market has become oversold thus the trader should purchase a certain amount of a given cryptocurrency since the market of that given cryptocurrency will start moving in an upward direction. The cryptocurrency trader can either place a buy market order which will instantly be executed or they can place a buy limit order which will be executed when the price reaches their limit price. This is indicated as from the candlesticks chart below;

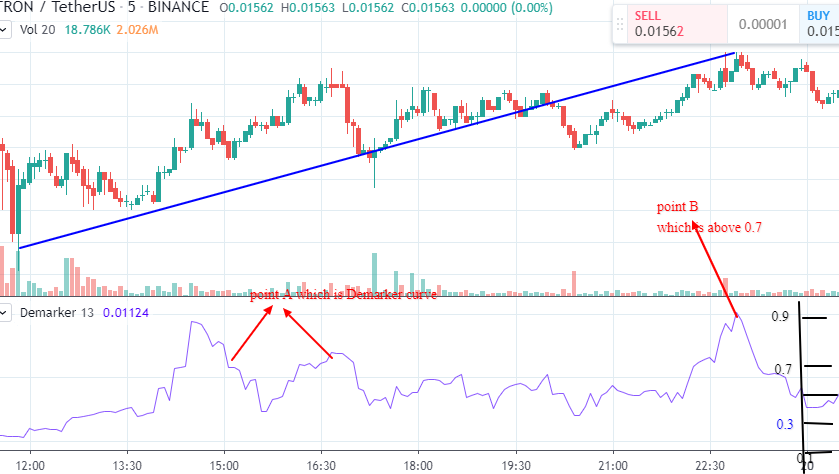
The above chart is a market for TRX in terms of USDT. Two points are being indicated,point A and point B. Point A represents the Demarker curve while point B is the point below 0.3 thus an oversold point. At point B where Demarker has fallen below 0.3,there is an oversold market for the TRX market in terms of USDT. The cryptocurrency trader should place a buy order of a given amount of TRX using a given amount of USDT available in their trading account.The cryptocurrency trader can either place a market buy order which will instantly be executed or they can place a limit buy order which will be executed when the market reaches their limit buy order. The cryptocurrency trader should use risk management while placing their buy order. The cryptocurrency trader will receive the amount of TRX purchased to their holding account. When the price of TRX has started to rise,the account of the trader will start increasing in value.

Overbought cryptocurrency Demarker indicator

Demarker indicator has its intervals oscillation at between 0.3 to 0.7.

When the demarker curve is between 0.3 to 0.7,then the cryptocurrency trader is not at any risk while in the market.At that range,the cryptocurrency trader can continue hold the cryptocurrency which he had previously purchased.If the demarker curve rises above 0.7,that is an indicator that the market has become overbought thus the trader should sell a certain amount of a given cryptocurrency which he had previously purchased and is currently holding since the market of that given cryptocurrency will start moving in a downward direction. The cryptocurrency trader can either place a sell market order which will instantly be executed or they can place a sell limit order which will be executed when the price reaches their limit price. This is indicated as from the candlesticks chart below;

The above chart is a market for TRX in terms of USDT. Two points are being indicated,point A and point B. Point A represents the Demarker curve while point B is the point above 0.7 thus an overbought point. At point B where Demarker has risen above 0.7,there is an overbought market for the TRX market in terms of USDT. The cryptocurrency trader should place a sell order of a given amount of TRX  which he had previously purchased and is currently holding to avoid making their account to start decreasing in value.The cryptocurrency trader can either place a market sell order which will instantly be executed or they can place a limit sell order which will be executed when the market reaches their limit sell order. The cryptocurrency trader will receive the amount of USD increased in amount as compared when they purchased the TRX . 

Recommendation: Cryptocurrency market is highly volatile. When you place a buy order, make sure to apply risk management to be safer incase your buy order goes against you.

You are always free to support our work from below;

skrill donation:mudigoomondi@gmail.com

Neteller donation:mudigoomondi@gmail.com

Bitcoin:3AFeiwUp6erj2iRBmdsnc7YhC7gcYVD6oj

Ethereum; 0x346570c491b76c7cd51699bdd272762111b743a9

Litecoin: LeEH7B82ccXJ6QoibCryGJNpDGNx2x77fL

Dogecoin: DLShs2vqhMc1ggqo8MPPMBTcPAZdqCZoWd

lightning network:tipping.me:https://tippin.me/@quintomudigo

Wave is a native cryptocurrency of the wave blockchain platform. Wave coin can therefore be transferred from one smart contract address to another where the receiver receives the transaction after it has been verified by different nodes running the wave platform. Because of this,wave coin is being considered to be a decentralized asset. Wave coin normally performs the utility function on the wave platform. Developers of different Dapps created on the waveplatform uses the wave coin to pay for transaction cost for running the Dapps on the waveplatform. Those developers can create and issue the token of their Dapps on the wave platform using the wave coin. With the wave coin,in order for the users of those Dapps to transfer their tokens from one smart contract address to another,they will need to pay a gas fee using the wave coin so that the transaction can be initiated by the nodes running the wave platform on the wave network.Since there is wave DEX and the wave coin is also a proof of stake coin,it therefore follows that users upon purchasing their wave coin in several exchanges,they will come to the wave DEX to lock them over there so that they can be used to secure the wave platform as well as to verify transaction taking place on the wave platform. Wave coin has a maximum supply of 100 million coins. In  2016,wave conducted its ICO where 1 wave coin was going for $0.19. Towards the end of 2016, 1 wave coin had risen very slightly to $0.2 . When 2017 was starting,1 wave was going for $0.24. Towards the end of 2017, the price of 1 wave coin went as high as $16 thus profiting those investors who had taken part in its ICO in 2016 and were holding their wave coin by that time. Towards the beginning of 2018,the price started trading at around $12. As 2018 was winding up,the price dropped further to $2. As 2019 was starting 1 wave coin started trading at $3. Currently, 1 wave coin is trading at around $0.712. Between year 2016 to 2017, most blockchains had not yet started initiating the development of Dapps in their network. The price movement of wave at that time can not be as a result of Dapps created on its network. Instead, it might be as a result of other factors such as liquidity and wave DEX usage as well as mass adoption of the coin. Between 2018 to 2019,that is when the Dapps industry started booming thus the price movement can be as a result of this. Dapps affects the price movement of wave coins as follows;

Dapps built on wave platform

Between 2016 to 2017,most blockchains had not implemented the Dapps creation on their network. During that time,wave coin has been performing well in the market such that it managed to rise from $0.19 to $0.24. This increase in price has been due to increase in its mass adoption. Between 2018 to 2019,the price has been seen rising tremendously all the way to $3 after it had managed to rise as high as $16 towards the end of 2017.. Currently, one wave coin is trading at around $0.712. Between 2018 to 2019,the rise in price has been due to increase in the number of Dapps being created on its network. In the near future,if Dapps continue to increase on the wave platform then its price will also increase while if developers shift their Dapps to other network,then its price will decline. Here are some of the Dapps created on the wave platform that are causing the price movement of the wave coin

a.Arker

This is a gaming Dapp based on the wave platform that rewards users with non-fungible token when they defeat their opponent. The non-fungible token can easily be converted to wave coin. If more gamers start playing this game,then the wave coin utility function will increase thus causing its price to increase while if the gamers start leaving the arker game for other game on other network because the reward for the game will have decline,then the wave coin utility function will decline thus causing its price to also decline

b.waveslend

This is an online lending platform based on waveplatform. Its has not yet being launched. When fully launched,i think wave coin utility function will increase when more users start using wave coin as their collateral to borrow loan.This will make the price of wave coin to also increase.On the other hand,when it has been launched then the already established users start leaving the platform because of high interest rate,then the wave coin utility function will also decline thus causing its price to also decline.

c. wave Dex

This is the decentralized exchange for wave platform. The exchange is being operated by several nodes. The users of the exchange are the one determining the price of wave coin.As more users will continue to increase in number in the near future to exchange the tokens of their Dapps to wave coin,the utility function of wave coin will increase since it will also be used to pay for fees to execute trade while if the existing users leave the exchange for other exchange,then the utility function of the wave coin will also decline thus resulting to a decrease in its price

Dapps built on wave platform can further be explained on the bullish and bearish condtion market for wave as follows;

1. Bullish market condition for wave coin based on Dapps built on its network

Between 2016 to 2019,the price of wave coin has been seen to have tremendously increased overtime from $0.19 to $16 and back to $3. Currently, one wave coin is trading at around $0.712. The tremendously increase in price has been due to an increase in the number of Dapps over the wave platform thus increasing the utility function of the wave coin. These Dapps are always joining the wave platform because of the wave DEX where they can easily convert their earning back to wave coin and again to bitcoin or ethereum. In the near future,if more developers will continue to join the wave platform,then the utility function of the wave coin will also increase thus causing the wave coin to also increase in price. In one year time from now, the price of wave coin can go as high as over $1 if more developers will join to develop on the wave platform.The future price analysis of wave coin is being indicated as from the candlesticks chart below;

From the price analysis of the wave coin above,there are two points,point A and point B. Before point A, the price of wave coin can be seen to have gone as high as $0.712. This increase in price has been due to an increase in the number of developers joining the wave coin to develop over there because of low cost charged on the network thus the monetization of their Dapps is not affected. The users of those Dapps then dump their earned wave coin in several exchanges including the wave DEX thus causing the price of wave coin to drop downwards to point A at $0.702. More developers who have joined to develop on the wave platform then purchase the wave coin in the Wave DEX thus causing its demand to increase.Because of this,the price rises again to point B. In the near future,if more developers will continue to join the wave platform to develop over there,then the utility function of the wave coin will also increase thus causing its price to increase much further. As an investor,this is the right time to purchase wave coin because there is possibility of increase in its mass adoption in the near future due to the availability of its DEX exchange

2. Bearish market condition for wave coin based on Dapps built on its network

Between 2016 to 2019,the price of wave coin has been seen to have tremendously increased overtime from $0.19 to $16 and back to $3. Currently, one wave coin is trading at around $0.712. The tremendously increase in price has been due to an increase in the number of Dapps over the wave platform thus increasing the utility function of the wave coin. These Dapps are always joining the wave platform because of the wave DEX where they can easily convert their earning back to wave coin and again to bitcoin or ethereum. In the near future,if existing developers will start leaving the wave platform due to increase in its transaction cost thus declining their revenue and start joining other platforms to develop there,then the utility function of the wave coin will also decrease thus causing the wave coin to also decline in price. In one year time from now, the price of wave coin can go as low as below $0.5 if more developers will  continue to leave the wave platform due to further increase in transaction cost over there .The future price analysis of wave coin is being indicated as from the candlesticks chart below;

From the price analysis of the wave coin above,there are two points,point A and point B. Before point A, the price of wave coin can be seen to have gone as low as $0.702. This decrease in price has been due to a decrease in the number of developers due to an increase in the transaction cost which decrease the monetization of their Dapps.The developers then join other blockchain whose transaction is lower as compared to wave platform so that they can increase the monetization of their Dapps.Some existing developers on the wave platform purchase the wave coin in some exchanges available thus creating a demand for the coin.Because of that,the price slightly rises a little bit to point A at $0.712. The wave platform further increase the transaction cost on its network thus forcing more developers to exit the platform and look for other cheaper blockchain entwork thus causing the utility function of wave coin to decline again to point B. In the near future,if more developers will continue to exit the wave platform for other cheap platform so that the monetization of their Dapp is not affected,then  wave coin will coninue to decline further. In one year time,the price can go as low as $0.5 if this is bound to happen . As an investor, if you feel this can happen, then this is the right time to sell your wave holding and purchase it after one year again when everything has been solved 

Summary

Wave coin is a native coin of wave blockchain and can be transferred from one smart contract address to another. In 2016 when the ICO was held,one wave was going for $0.19. In one year time,one wave managed to go as high as $16 but later dropped to $3. Currently,wave coin is trading at above $0.7. When wave coin is increasing in price,it can be considered to be in a bullish market condition while when it is decreasing in price,it can be considered to be in a bearish market condition. When developers are increasing in number to develop on the wave platform,the utility function of wave coin will increase thus causing its price to increasing while when developers are decreasing in number due to increase in transaction cost and scalability issues,then its utility function will also decrease thus causing its price to also decrease.

You are always free to support our work from below;

skrill donation:mudigoomondi@gmail.com

Neteller donation:mudigoomondi@gmail.com

Bitcoin:3AFeiwUp6erj2iRBmdsnc7YhC7gcYVD6oj

Ethereum; 0x346570c491b76c7cd51699bdd272762111b743a9

Litecoin: LeEH7B82ccXJ6QoibCryGJNpDGNx2x77fL

Dogecoin: DLShs2vqhMc1ggqo8MPPMBTcPAZdqCZoWd

lightning network:tipping.me:https://tippin.me/@quintomudigo

Commodity channel index is an oscillator indicator.

As an oscillator indicator,Commodity channel index was developed by Donald Lambert to help traders measures the deviation of a commodity price from its average statistical price thus enabling them to know whether the market is in an overbought or oversold market condition.When the value of the commodity channel index is high,that is an indication  that the price is also high while when the value of the commodity channel index is low that is an indication that the price is also low.

These values are gotten by following the procedures as follows;

-Finding the typical price by adding the high,the low and the close price of each bar and then divide the whole result by 3.This is as follows;

TP=(HIGH+LOW+CLOSE)/3

-calculating the n-period SIMPLE MOVING AVERAGE of typical price.This is as follows;

SMA(TP,N)=SUM(TP,N)/N

-Subtraction SMA(TP,N) from typical prices of each of preceding n-periods.This is as follows;

D= TP-SMA(TP,N)

-Calculating the n-period SIMPLE MOVING AVERAGE of absolute D values.This is as follows;

SMA(D,N)=SUM(D,N)/N

-Multiplying the received SMA(D,N) by 0.015.This is as follows;

M=SMA(D,N)*0.015

-commodity channel index(CCI) is then gotten by dividing M by D.This is as follows;

CCI= M/D

Where as;

HIGH is maximum bar price

LOW is minimum bar price

CLOSE is close price

SMA is Simple Moving Average

N is number of periods used for calculation while;

SUM is the sum.

Commodity channel index oversold market

Since commodity channel index has an oscillation at point 0 where the CCI oscillates above or below, it therefore follows that When the CCI curve is below  0,that will be an indication that the cryptocurrency market is trending downwards thus the cryptocurrency trader should be trading in a downward market direction. On the other hand,when the CCI rises falls below -100(negative 100 ) that is an indication that there is an oversold  in the market thus the cryptocurrency trader should place a buy order of a given  amount of cryptocurrency  that he wants to start holding so that when the price of that bought cryptocurrency starts rising,his account will also start increasing in value. This is indicated as from the candlestick chart below;

From the candlesticks chart above,there are two points,point A and point B. Point A represents the commodity channel index while point B represents the oversold point position.At point B,the commodity channel index has fallen below -100 thus an indication of an oversold condition at that point.This will signal the cryptocurrency trader to place a buy order of a given amount of TRX coin and start holding it. The cryptocurrency trader can either place a market buy order which will be executed instantly or can decide to place a limit order which will be executed when the market reaches that price.As soon as the price starts moving upwards,the account of cryptocurrency trader will start to increase in value in terms of USDT.

commodity channel index overbought market

Since commodity channel index has an oscillation at point 0 where the CCI oscillates above or below, it therefore follows that When the CCI curve is above  0,that will be an indication that the cryptocurrency market is trending upwards that he should be trading in an upward market direction. On the other hand,when the CCI rises above +100(positive 100 ) that is an indication that there is an overbought  in the market thus the cryptocurrency trader should place a sell order of the amount of cryptocurrency which he had previously purchased and was holding so that they can avoid making the account to decline in value. This is indicated as from the candlestick chart below;

From the candlesticks chart above,there are two points,point A and point B. Point A represents the commodity channel index while point B represents the overbought point position.At point B,the commodity channel index has risen above +100 thus an indication of an overbought at that point.This will signal the cryptocurrency trader to place a sell order of the amount of TRX coin which he had previously bought and was holding by that time to avoid his account to start declining in value in terms of USDT when the price of TRX will start declining.

Recommendation: Cryptocurrency market is highly volatile. When you place a buy order, make sure to apply risk management to be safer incase your buy order goes against you.

You are always free to support our work from below;

skrill donation:mudigoomondi@gmail.com

Neteller donation:mudigoomondi@gmail.com

Bitcoin:3AFeiwUp6erj2iRBmdsnc7YhC7gcYVD6oj

Ethereum; 0x346570c491b76c7cd51699bdd272762111b743a9

Litecoin: LeEH7B82ccXJ6QoibCryGJNpDGNx2x77fL

Dogecoin: DLShs2vqhMc1ggqo8MPPMBTcPAZdqCZoWd

lightning network:tipping.me:https://tippin.me/@quintomudigo

Loom coin is a native coin of the loom network. As a loom network coin,loom coin can be transferred from one user to another without involvement of a third party .The transaction will reach the second peer upon being verified by nodes running the loom network.Because of this,loom coin is considered as a decentralized asset.At loom network,different developers can develop their Dapps over there as well as they can create and issue their tokens over there using the loom coin.The Dapps will be charged with loom coin for operating over the loom network while to send the tokens of the Dapps from one smart contract address to another,a certain amount of Loom will be charged as a transaction fees.With Loom coin,different users can use them to vote to any of the verified validators. The validators will use the vote to secure the loom network and to validate any transaction taking place on the loom network.Loom coin has a maximum supply of 1 billion coins. During its ICO in early 2018, one loom coin was going for $0.076. In a very short period of time,the price went as high as $0.77. The price went down again to $0.055 while 2019 was starting. Currently, 1 loom coin is trading at a $0.022. The increase in the price of loom coin from $0.076 to $0.77 was caused by the delegated proof of stake consensus used by the loom coin. Many delegators had delegated most of their coins to several delegates so that they can be used to secure the network and to verify any transaction taking place on the loom network thus making the loom coin to become inefficience in its network thus its demand increases thus causing its price to increase. The way in which delegated proof of stake consensus affects the price movement of the loom coin can further be explained as from below;

Delegated proof of stake consensus

In a delegated proof of stake consensus, delegates and delegators are the key players. Delegates voting power to run the network will be determined by the votes they receive from different delegators.The top delegates with highest number of votes are the one who will be selected to run the network. When more delegators delegate their votes to different top selected delegates,the loom coin will become inefficiency in its network thus resulting to an increase in its price while if few delegators delegate less of their votes to different delegates,then the loom coin will be in surplus in its network thus causing its price to decline. Here are some of the top delegates who are affecting the price of loom coin

  a.Huobi wallet

  b.cobo wallet

c. stake.withus 

d.loom validator  

e.plasma-5  

f.multichain ventures  

g.stake capital  

h.stake.fish  

The above delegates are the one affecting the future price movement of the loom coin. When more coins are being staked in any of these staking validators, they become inefficiency thus making it become stable. The future price based on the delegated proof of stake can further be explained based on bullish and bearish market condition as follows;

  1. Loom bullish condition based on consensus used

  Loom coin uses the delegated proof of stake consensus. In the delegated proof of stake consensus, the delegators use their loom coins to vote for delegates to use them to secure the network as well as to validate any transaction taking place on the loom network then in return they receive reward in form of fees charged as well as new coin minted. Many delegators have been seen using their coins to vote to different loom network delegates so that they use those coins to secure the loom network and to verify any transaction taking place on the loom network. Because of this, the loom coin is becoming inefficiency in its network since most of it is being locked for reward in several staking delegates wallets .Because of this,its demand increases thus causing its price to increase. As more delegators will continue to delegate their coins to several delegates to use them to secure the network,the inefficiency of the loom coin will increase much further thus causing its demand to increase much further. This will result to a further increase in its price. This is indicated as from the candlesticks chart below.    

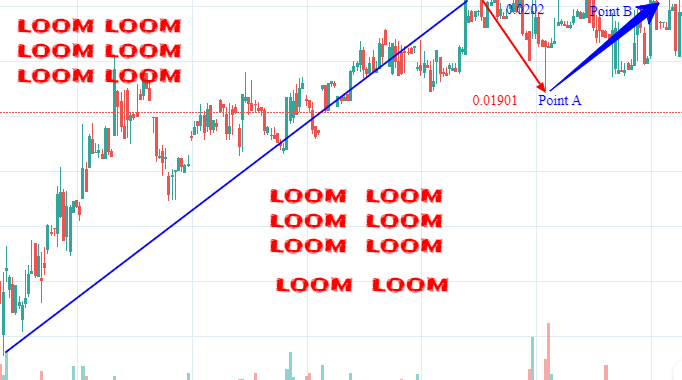
  From the price analysis of the loom coin above,there are two points ,point A and point B. Before point A, the loom coin can be seen to have gone as high as $0.0202. This increase in price has been due to an increase in the number of delegators delegating their loom coins to several delegates thus causing the loom network to become inefficiency of loom coin. Because of this, its demand increases thus causing its price to also increase. Some delegators who were staking their coin to several delegates wallet then unlock them together with the reward and sell them in the available exchanges thus causing the price to decline to point A at a price of $0.01901. More delegators then join the staking program by purchasing some loom coin in several exchanges after which they take them to lock them to several top delegates.Because of this, the loom coin becomes inefficiency again in its network thus creating its demand again thus causing the price to rise again to point B. In the near future, if more delegators will continue to join the staking program because of an increase in the reward,then the loom coin will further become inefficiency in its network thus creating much more demand. If those coins can be locked for a period of one year,then there is possibility of the price to go as high as $0.04. As an investor,this is the right time to buy since the reward of loom coin is high in staking which can lure many people to lock their coin in several delegates.  

  2. Loom bearish condition based on consensus used  

Loom coin uses the delegated proof of stake consensus. In the delegated proof of stake consensus, the delegators use their loom coins to vote for delegates to use them to secure the network as well as to validate any transaction taking place on the loom network then in return they receive reward in form of fees charged as well as new coin minted. Many delegators have been seen using their coins to vote to different loom network delegates so that they use those coins to secure the loom network and to verify any transaction taking place on the loom network. Because of this, the loom coin is becoming inefficiency in its network since most of it is being locked for reward in several staking delegates wallets .Because of this,its demand increases thus causing its price to increase. If the reward in the near future decline due to Dapps leaving the network because of high fees charged more delegators will unlock their coin from several delegates and start dumping them in several exchanges thus causing its surplus in the loom network to increase . This will cause its price to decline. This is indicated as from the candlesticks chart below.  

From the price analysis of the loom coin above,there are two points ,point A and point B. Before point A, the loom coin can be seen to have gone as low as $0.01901. This decline in price has been due to a decrease in the number of delegators who were  delegating their loom coins to several delegates thus causing the loom network to become in surplus of loom coin. Because of this, its supply increases thus causing its price to also decrease. New delegators enter the loom staking business where they purchase the loom coin in several exchanges thus creating a demand for it again thus causing its price to rise to point A at $0.0202. Loom network increases its transaction cost thus causing many Dapps to exit the loom network and look for other network to develop on thus resulting to a decline in the staking reward program.Because of this,more delegators then unlock their loom coin in several exchanges together with their reward thus creating a surplus of loom coin again in its network.Because of this,the price falls down again to point B. In one years to come,if many delegators will have exit the loom staking program because of very low reward,then loom coin will not have anyone to hold it thus many its surplus to become in excess in its network.The price might end up falling further to below point B thus in one year time it might go as low as $0.016.As an investor,if you feel staking reward will reduce because of high fees charged and you are a loom staker,then this is the right time for you to sell all your loom holding and purchase it after one year again.

  Loom coin uses a delegated proof of stake consensus. In its consensus,delegators use their loom coin to vote for delegates to secure the loom network and to validate any transaction taking place on the loom network. Their coins get locked for a given period of time after which they receive reward when the locking period is over .When the loom coins are being locked in delegates wallet,they will become inefficiency in the loom network thus making it to become stable. Therefore,we can say that an increase in the staking of the loom coin will result to an increase in its price while a decrease in the staking of the loom coin will result to a decrease in its price

You are always free to support our work from below;

skrill donation:mudigoomondi@gmail.com

Neteller donation:mudigoomondi@gmail.com

Bitcoin:3AFeiwUp6erj2iRBmdsnc7YhC7gcYVD6oj

Ethereum; 0x346570c491b76c7cd51699bdd272762111b743a9

Litecoin: LeEH7B82ccXJ6QoibCryGJNpDGNx2x77fL

Dogecoin: DLShs2vqhMc1ggqo8MPPMBTcPAZdqCZoWd

lightning network:tipping.me:https://tippin.me/@quintomudigo

Relative strength index is an oscillator indicator.

Being an oscillator indicator,Relative Strength Index was developed by J.Welles Wilder with the main objective of helping traders to know of an overbought or oversold market condition. According to J.Welles Wilder,Relative strength index is used to measure the speed and change of price movements.Relative strength index ranges between 0 and 100. Relative strength index is based on overbought and oversold condition. For overbought condition,the RSI rises above 70 while for oversold condition the RSI falls below 30.

RSI has a time default of 14 period.

RSI is calculated using the following formulae;

RSI\= 100 -  100     

              1+RS

where

RS= Average Gain/ Average Loss

      Oversold Cryptocurrency Market  FOR RSI

For oversold market, the Relative strength  Index will fall below 30.This will signal the cryptocurrency trader to buy certain amount of a given cryptocurrency in terms of USDT if they want to grow the USDT account or in terms of bitcoin if they want to grow their bitcoin account. The cryptocurrency trader will then hold the amount of cryptocurrency bought until its price rises above the previous price which they will have purchased at .Here is how it looks like;

From the candlesticks chart above,there are two points,point A and point B. Point A represents the RSI while point B represents the oversold point.At point B,the RSI has fallen below 30 thus an indication of an oversold point over there. This will signal the TRX trader to place a buy order of a certain amount of TRX. The trader can either decide to use market order or limit order.For market order,their order will instantly be initiated thus they receive the amount of TRX they purchased to their account.As you can see,the market has started to move upwards. Their account in terms of USDT will start increasing in value

              Overbought cryptocurrency market for RSI

For overbought market, the Relative Strength index will rise above 70. This will signal the cryptocurrency trader of an overbought market condition.This will signal the TRX trader to sell the amount of TRX which he had previously purchased and was holding in order to avoid making his account to start declining in value in terms of USDT. This is indicated as from the candlesticks chart below;

The candlesticks chart above represents the market for TRX against USDT.

From the candle sticks chart above, there are two points,point A and point B. Point A is the RSI while point B represents the overbought market condition. At point b,the RSI has risen above 70 thus an indication of an overbought market condition. This signals the TRX trader to sell the amount of TRX which he had previously purchased and was holding to avoid causing a decline in value of his account in terms of USDT. The TRX trader can either decide place a sell market order whose transaction will be initiated instantly or a sell limit order whose transaction will be initiated upon reaching the limit order price

Recommendation: Cryptocurrency market is highly volatile. When you place a buy order, make sure to apply risk management to be safer incase your buy order goes against you.

You are always free to support our work from below;

skrill donation:mudigoomondi@gmail.com

Neteller donation:mudigoomondi@gmail.com

Bitcoin:3AFeiwUp6erj2iRBmdsnc7YhC7gcYVD6oj

Ethereum; 0x346570c491b76c7cd51699bdd272762111b743a9

Litecoin: LeEH7B82ccXJ6QoibCryGJNpDGNx2x77fL

Dogecoin: DLShs2vqhMc1ggqo8MPPMBTcPAZdqCZoWd

lightning network:tipping.me:https://tippin.me/@quintomudigo

  0x which is abbreviated as ZRX coin is a native cryptocurrency of the  0x decentralized platform  created and issued on  the ethereum blockchain network  whose transaction takes place from one peer to another without involvement by the government thus is being considered to be a decentralized asset. As a native coin of the 0x DEX,it enables different developers as well as owners of different websites as well as Dapps to be able to integrate the 0x DEX API into their platform where the integrators will set the fees to be charged such that they will be earning those fees as income whether a swap of ERC20 token is being swapped from one asset to another.Game developers can also integrate the non-fungible tokens so that they can be swapped to fungible tokens. Since it is based on ethereum network,the fees for transferring ZRX from one smart contract address to another is paid using ether gas.In the near future,0x will introduce staking program thus ZRX will be able to be used to vote in the future.

Ox coin transaction 

Ox coin transaction takes place on the ethereum blockchain explorer based on block height and timestamp.Here is a view of the transaction;

To view how the transaction takes place on the ethereum  blockchain, you can follow the link below; https://etherscan.io/token/0xe41d2489571d322189246dafa5ebde1f4699f498      

Date Launched

The 0x coin poject was created and launched in 2017 with the main objective of making it easier for ERC token swapping.Game developers were also considered since non-fungible assets can also be tradeable with one another as well as in terms of ZRX.

Founder Of 0x(ZRX)  coin

ZRX coin project was created by Will Warren who serves as company's CEO and Amir Bandeari who serves as company CTO.Their main objective for creating ZRX project was to make it easy for ERC20 tokens as well as non-fungible assets to be easily swapped with one another

Process of creating 0x(ZRX) coin  

No staking program has been introduced yet though ZRX is set to become a staking coin in future. Currently,when you link the 0x DEX platform to your website or Dapp then users swap ERC20 token from one asset to another or Dapps users convert non-fungible assets to ZRX coin,then part of the fees charged will be considered as your income.   If you would like to also take part in linking the 0x DEX to your platform to enable users to swap one ERC20 token to another instantly so that you can receive fees charged when the swapping is taking place,then you can follow the link from below;

https://0x.org/instant  

  Maximum circulation of 0x(ZRX) coin

  The maximum amount of ZRX that should be circulating in the ethereum network should be 1 billion coin. During its launch, 500 million coins were set aside for token launch to cater for governance while another 150 million coins were retained by 0x organization. Another 150 million coins were set aside for external development while another 100 million coins were issued to team members while another 100 million coins to early backers and advisors. Here is how the distribution looks like;  

0x coin  Price

Currently, 1 0x  coin is worth more than $0.27 and its price is expected to increase over the next period of time . 0x coin is being abbreviated as  ZRX.  

Converting my 0x coin  to other cryptocurrencies

To convert your 0x coin to other cryptocurrencies such as bitcoin and Ethereum, you need to have a cryptocurrency exchange account. If you don't own one then you can follow the link to open a cryptocurrency exchange account for easy conversion of your ZRX coin to Bitcoin or Ethereum.  

https://www.coinex.com/ 

https://pro.coinbase.com/   

https://www.binance.com/en

https://www.bitfinex.com/ 

 https://bitmax.io/

https://poloniex.com/ 

 https://global.bittrex.com/  

Storing my 0x coin

To store your 0x coin, you need a 0x wallet compatible to ERC20 token . You can either store online or offline. To store your 0x coin online, you can either use myether wallet or metamask for ERC20 . To securely store your 0x coin offline from being stolen by hackers, you can use ledger Nano wallet.

Transferring my  0x(ZRX) coin to other Users

If you want to transfer your ZRX coin to another user, the two of you must have trust in each other. The trust should be the ZRX coin address provided for by the receiver while the sender must have the ZRX coin balance in their account to send to the receiver. For the sender, a blank space to insert the receiver address and another blank space to insert the amount to send to the receiver is indicated. Here is how it looks like;  

  Knowing more About 0x coin

If you feel that you need to learn more about 0x coin, then you can follow them on their site. Here is the link redirecting you to 0x coin platform website 

https://0x.org/  

You can as well read their white paper to learn more about their idea from below

https://0x.org/pdfs/0x_white_paper.pdf 

  You can also join as a community member in any of their social media platform from below to follow the discussion made by other community members;  

twitter:https://twitter.com/0xproject

discordapp:https://discordapp.com/invite/d3FTX3M

facebook:https://www.facebook.com/0xProject/

reddit:https://www.reddit.com/r/0xProject/

Now that you know, I think that it is time for you to start earning some ZRX on your Dapp or website in form of transaction cost for allowing other users to swap both non-fungeable assets to asset as well as ERC20 tokens from one asset to another The more the swapping power from your integration the more your reward.If you feel that we should also own some Ox(ZRX) coin for simply helping you know about it then here is our 0X coin address compatible to ERC20.

0x829a03ca847DD1Cbf1E4fc102337787B2e28800c

            Loom is a cryptocurrency on the loom network that can be transferred from one peer to another where the receiver receives the sent amount upon the transaction being verified by the nodes running the loom network after which they receive the transaction fee as their income.Because of this,loom coin is considered to be a decentralized utility asset.As a decentralized utility asset,developers can use it to pay for their Dapps on the loom network as well as they can use it to create and issue the token of their Dapps.Loom owners can also use the loom coin to pay for transaction cost while transferring the loom coin from one smart contract address to another so that the transaction can be initiated by nodes running the network.Dapp users can also use the loom coin to pay for transaction cost for transferring their earned token of respective Dapps from one smart contract address to another.Furthermore,loom coin was created to become a delegated proof of stake coin thus users can use their loom coin to vote to the nodes running the network where those coins will be used to secure the loom network and to verify any transaction taking place on the loom network.As 2018 was starting,loom network conducted their ICO project.During the ICO period,one loom coin was going for $0.076. 4months later,the price of one loom coin had managed to go as high as $0.77. Towards the beginning of 2019,the price of one loom coin dropped down again to as low as $0.055 . Currently,1 loom coin is trading at $0.022 . The increase in price from $0.076 to $0.77 was due to an increase in the listing of loom coin to several exchanges thus increasing its liquidity.The decrease in the price again to $0.022 where it has managed to stabilize at that range was due to the dumping of loom coin in those exchanges by those loom users who were holding it .The liquidity of the loom coin affects its price movement as explained below;  

Liquidity of Loom coin

  Loom coin is considered to have a high liquidity when it is listed in several exchanges and a low liquidity when it is listed in very few exchanges.When more exchanges list loom coin,it will become inefficiency in its network thus its price will increase.Some of the exchanges making loom coin to become very much liquidity are being explained and indicated as from below;

https://www.binance.com/ 

Binance is a Malta based cryptocurrency exchange. On the exchange,loom is available for trading in three pairs.The first pair is Loom/BTC, the second pair is Loom/ETH while the third pair is Loom/BNB. With the BTC pair,loom normally manages to exceed a daily trading volume of over 100 BTC while with the ETH pair,it normally manages to reach a daily trading volume of  over 400 ETH. For BNB,its daily trading volume is normally over 400 BNB. This is an indication that there are many buyers and sellers of the Loom coin at the binance exchange thus stabilizing its price over there.If the number of buyers and sellers increases in number on the binance exchange,then its price will stabilize much further while if they reduce in number, then the stability will also decline. Here are some of other exchanges where loom coin is being listed over there;  

https://pro.coinbase.com/ 

https://global.bittrex.com/  

 https://www.kucoin.com/

https://poloniex.com/   

https://omgfin.com/

https://bilaxy.com/ 

 https://www.hbg.com/en-us/

https://hitbtc.com/  

https://www.coinex.com/   

https://www.hotbit.io/

https://atomars.com/   

The listing of Loom coin in several exchanges from above makes it to become very much more liquidity thus stabilizing its price.Its future price prediction can further be explained based on its bullish and bearish condition as follows  

1.Loom bullish condition based on its liquidity

  Loom coin is being listed in several exchanges. This listing makes it a very much liquidity cryptocurrency. As a liquidity cryptocurrency,Loom coin is very much stable such that its price normally ranges at around $0.022. In the near future,if more exchanges will continue to list Loom coin in their platform,then its demand will increase since it will be inefficiency in its blockchain thus causing its price to increase. The exchanges which will have listed Loom coin to their platform will make the work of users of the Dapps created on the loom network very easy since they will be having several alternative where they can convert their earned Loom coin to their favorite cryptocurrencies such as bitcoin and ethereum. The future price analysis of loom coin based on bullish condition is further being indicated as from the candlesticks chart below;  

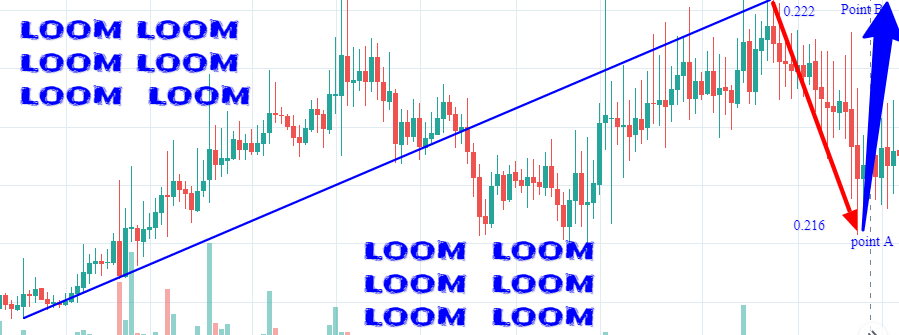
From the price analysis of Loom coin from the candlesticks chart above,there are two points,point A and point B. Before point A,the price of Loom coin can be seen to have gone as high as $0.0222. This increase in price was due to an increase in the number of cryptocurrency exchanges listing the Loom coin in their platform thus making it to become inefficiency in its network thus creating its demand. The price then falls to point A at a price of $0.0216. This decrease of price was due to several users of Dapps created on the Loom network dumping their earned Loom coin to several exchanges thus making it to become in surplus over there. More cryptocurrency exchanges enters the exchange industry where they list the Loom coin in their platform thus causing its price to move up back to point B. In the near future,if more exchanges will continue to join the industry and list the Loom coin in their platform, its price can move further to above point B. In one year from now,there is a possibility of the Loom coin to reach as high as $0.04 if more exchanges will continue to list it. For an investor,you can purchase loom coin at its current market price of $0.022 because it has potential  

2.Loom bearish condition based on its liquidity

  Loom coin is being listed in several exchanges. This listing makes it a very much liquidity cryptocurrency. As a liquidity cryptocurrency,Loom coin is very much stable such that its price normally ranges at around $0.022. In the near future,if  exchanges will start  to delist Loom coin in their platform due to low trading volume since most developers will have shift to other network since the fees charged on loom network will be high by that time thus lowering the revenue of their Dapps,then its demand will decline thus causing its surplus to increase on its  blockchain thus causing its price to decline. The exchanges which will have delisted Loom coin from their platform will make the work of users of the Dapps created on the loom network very hard since they will be having few exchchanges such as the Loom DEX where they can convert their earned Loom coin to their favorite cryptocurrencies such as bitcoin and ethereum. The future price analysis of loom coin based on bearish condition is further being indicated as from the candlesticks chart below;

From the price analysis of Loom coin from the candlesticks chart above,there are two points,point A and point B. Before point A,the price of Loom coin can be seen to have gone as low as $0.0216. This decrease in price was due to a decrease in the number of cryptocurrency exchanges listing the Loom coin in their platform thus making it to become surplus in its network thus creating its supply. The price then rises to point A at a price of $0.0222. This increase in price was due to several users of Dapps created on the Loom network buying the Loom coin in few remaining  exchanges so that they can use the coin to pay for transaction costs . More cryptocurrency exchanges continue to delist loom coin  thus causing its price to move downwards  back to point B. In the near future,if more exchanges will continue to delist the Loom coin in their platform, its price can move further to below point B. In one year from now,there is a possibility of the Loom coin to reach as low as $0.015 if more exchanges will continue to list it incase the transaction fees will be increased thus hindering many developers to join the platform. For an investor,you can sell loom coin at its current market price of $0.022 if you feel this can happen.

  Summary

Loom coin which is a cryptocurrency bringing developers and users together on loom network has been performing well since its launch. Price started from $0.076 to $0.77 and back to $0.022.An increase in price has been due to increase in exchanges listing Loom coin while a decline in price was due to dumping of Loom by several users. In the near future,an increase in the number of exchanges to list Loom coin will increase its demand thus its price will increase further while an increase in the number of exchanges delisitng the coin will create supply in those exchanges thus causing its price to decline.