quintomudigo

Trader, blockchain technologist and contentpreneur

Moving average weight is a trend  following indicator.

Being a trend following indicator,Moving average indicator was created to enable traders to know the direction of the market based on support and resistance.Moving average weight normally places more weight on recent price and less weight on previous price thus considered to be more significance than simple moving average

Moving average weight normally gives the weight average of the last price with a decreasing order thus the formula is derived as follows;

Let say that the last weight average price  is n, then we will have

moving average weight = (P1*n)+(P2* n-1)+(P3* n-2)+(P4* n-3)/{(n)+(n-1)+(n-2)+(n-3)}

where P is the price and n is the weight average price.

Therefore, since moving average weight is based on bullish and bearish market, it therefore follows that when the market is in an upward trend, the moving average weight curve will also be trending upwards while when the market is in a downward trend, the moving average weight will also be trending downwards.

Therefore,if the moving average weight is moving upwards while the price is also moving upwards ,then the price rises above the moving average weight, that will be an indication that the market is about to start a downward trend thus signaling the trader to exit upward trend and enter a downward trend market.

On the other hand, if the moving average weight is moving downwards while the price is also moving downwards,then the price falls below the moving average weight, that will be an indication that the market is about to start an upward trend thus signaling the trader to exit downward trend and enter an upward trend.This is indicated as from the candle sticks chart below;

From the candle sticks chart above , the blue curve line represents the moving average weight .There is also two points, A and B which represent support and resistance points.At point A, the market and the moving average weight curve were initially moving downwards.The price then falls below the moving average weight thus reversing the market and the moving average weight to an upward market direction.This signals the trader to exit any downward position and open an upward position since the movement is starting upward trend as indicated by the arrow.On the other hand , at point B, the market and the moving average weight curve were initially moving upwards.The price then rises above the moving average weight thus reversing the market and the moving average weight to a downwards market direction. This signals the trader to exit any upward position and open a downward position since the movement is starting a downward trend as indicated by the arrow.

Recommendation:If you are a day trader just use 1 min, 5 min, 15 min and 30 min timeframe while if you are a swing trader just use 1 hour and above timeframe if you want moving average weight to work well for you.

skrill donation:mudigoomondi@gmail.com

Neteller donation:mudigoomondi@gmail.com

Bitcoin:1Fp5aLgRB6WJnC7nxGw57M3JbbexaAWHG2

Ethereum; 0x346570c491b76c7cd51699bdd272762111b743a9

Litecoin: LeEH7B82ccXJ6QoibCryGJNpDGNx2x77fL

Dogecoin: DLShs2vqhMc1ggqo8MPPMBTcPAZdqCZoWd

lightning network:tipping.me:https://tippin.me/@quintomudigo

BAT is an Ethereum based token created on the Ethereum network platform and can be transferred from one user to another without a third party involvement. The different mining nodes of the ethereum network are the one who will validate the transfer of BAT token from one peer to another thus in return they receive reward in form of ethereum gas .BAT token was mainly created to become a native coin of the brave browser. As a native coin of the brave browser, BAT coin connects publishers to advertisers via the brave users.The advertisers purchase the BAT coin to advertise their business on the brave browser such that when publishers publish their work then certain users happen to come across the advert while using the brave browser while at the same time they are consuming the work of certain publisher, then that publisher will earn the reward. The user will also earn some reward for watching the advert. During the Q2 of 2017, BAT conducted its ICO where one BAT coin was going for $0.03. In a very short period of time, the ICO managed to raise over $30 million . Towards the end of December 2017, the price had managed to go as high as $0.4 thus making those who took part in its ICO and were holding the coin by that time to profit.Towards the beginning of 2018, the price then managed to go as high as $0.95 thus making those who continued holding at price $0.4 to profit more.Towards the end of 2018, the price of one BAT coin then drop further to $0.13. In the beginning of 2019 one BAT coin started trading at a price of $0.13 . Since then the price of 1 BAT has been performing well and has managed to maintain over $0.13. Currently, one BAT is trading at $0.23. This price can be affected by publishers, advertisers and users behaviour . The publishers will affect the BAT market price as follows;

1.Publishers behaviour

Since BAT coin was mainly created to reward publishers for their great content, it therefore follows that an increase in the number of publishers on Brave browser will result to an increase in the BAT token price while a decrease in the number of publishers on the brave browser will result to a decrease in the price of BAT token. This can further be explained using the bullish and bearish market as follows;

BAT bullish market based on publishers behaviour

When BAT coin is in its bullish market condition, then it is considered to be moving in an upward market direction.Since BAT coin was created to become a native coin of the brave browser, it therefore follows that when more publishers are joining the brave browser to share their content, more advertisers will also be joining the platform to advertise their business via the brave browser on the content of those publisher. Because of this, the advertisers will purchase huge amount of BAT token thus causing its price to increase. In the near future, if more publishers joined the brave platform to share their work, then more advertisers will also join the platform to advertise their business thus the BAT coin will increase much further to over $0.30 as compared to its current price at $0.23. Here is how the BAT coin future market price analysis looks like;

From the BAT future price analysis above based on publishers behaviour, there are two points , point A and point B. Before point A, the price of BAT coin can be seen to have gone as high as $0.236. This increase in price is due to an increase in the number of publishers in the Brave platform to share their work. These publishers then dump some of their earned BAT token to several exchanges thus causing the price to move a little bit to point A at $0.220. Some advertisers then demand for the BAT coin in order to advertise their work. More publishers then join the platform thus causing the BAT coin to continue moving further to point B. In the near future, if more publishers continue to join the platform because the reward will have increased due to an increase in the number of advertisers, then the price of one BAT coin will continue increasing further thus it might end up surpassing at a price of over $0.3

BAT bearish market based on publishers behaviour

When BAT coin is in its bearish market condition, then it is considered to be moving in a downward market direction.Since BAT coin was created to become a native coin of the brave browser, it therefore follows that when more publishers are leaving the brave browser publishers program due to several factors like a decline in their earning ,advertisers will also be leaving the platform to look for other platforms with huger users base to advertise their business . Because of this, few advertisers will purchase little amount of BAT token while more users and publishers will be dumping their earned BAT token on several exchanges thus causing its price to decline. In the near future, if more publishers leave the brave platform due to further decline of its reward , then more advertisers will also leave the platform and look for other platforms to advertise their business thus the BAT coin will decline much further to below $0.22 . Here is how the BAT coin future market price analysis looks like based on publishers behaviour;

From the BAT future price analysis above based on publishers behaviour, there are two points , point A and point B. Before point A, the price of BAT coin can be seen to have gone as low as $0.22. This decrease in price is due to a decrease in the number of publishers in the Brave platform to share their work due to a decrease in brave reward program. Some advertisers then purchased some BAT coin to advertise their business on brave platform thus causing the price to move a little bit to point A at $0.236. More advertisers then also leave the brave platform due to a decrease in number of publishers.As more advertisers leave the platform more publishers also lave the platform thus causing the BAT coin to continue moving further to point B. In the near future, if more publishers continue to leave the brave platform because the reward will have decline due to a decrease in the number of advertisers, then the price of one BAT coin will continue declining much further thus it might end up dropping further to below $0.2.

Stay tuned to more BAT analysis price based on advertisers behaviour

Supertrend is a trend following indicator.

Being a trend following indicator, Supertrend indicator was created by Olivier Seban with the main objective of helping traders to know whether the market is trending in an upward or downward direction based on previous high price and previous low price.

Supertrend indicator has red and blue lines.Blue line indicates the upward market direction while red line indicates the downward market direction

Supertrend indicator is based on ATR  of the upper and lower supertrend with a multiplier and therefore is calculated using the following formula;

upper supertrend= (high+low)/2+(multiplier*ATR)

lower supertrend=(high+low)/2-(multiplier*ATR)

Supertrend indicator can further be explained as follows;

Since supertrend indicator is based on previous low and previous high price, it therefore follows that when the supertrend indicator rises above the previous high price,the supertrend will turn red thus an indication that the market has gained resistance point thus signaling the trader to close any buy position and open a sell position since the market will start moving downwards.

On the other hand, if the supertrend indicator falls below the previous low price, the supertrend will turn blue thus an indication that the market has gained support thus signaling the trader to close any sell position and open a buy position since the market will start moving upwards. This is indicated as from the candle sticks chart below;

From the candle sticks chart above, the red and the green curve is the supertrend indicator.There is also two points, A and B which represent below lowest price and above highest price. At point A, the market was initially moving downwards.The supertrend indicator then falls below the previous highest high price at point A thus indicating a support point condition at point A. This will signal the trader to close any sell position and open a buy position since the market is starting an upward trend as indicated by the upward arrow.

On the other hand, at point B,the market was initially moving upwards. The supertrend indicator then rises above the previous highest high price at point B, thus indicating a resistance point at point B. This will signal the trader to close any buy position and open a sell position since the market is starting a downward trend as indicated by the downward arrow.

Recommendation: If you are a day trader, just use 1 min, 5 min, 15 min and 30 min timeframe while if you are a swing trader just use 1 hour and above timeframe if you want supertrend indicator to work well for you.

skrill donation:mudigoomondi@gmail.com

Neteller donation:mudigoomondi@gmail.com

Bitcoin:1Fp5aLgRB6WJnC7nxGw57M3JbbexaAWHG2

Ethereum; 0x346570c491b76c7cd51699bdd272762111b743a9

Litecoin: LeEH7B82ccXJ6QoibCryGJNpDGNx2x77fL

Dogecoin: DLShs2vqhMc1ggqo8MPPMBTcPAZdqCZoWd

lightning network:tipping.me:https://tippin.me/@quintomudigo

NEO is a cryptocurrency created on the NEO blockchain platform whose transaction takes place from one peer to another after being verified by different nodes running the network .There is no centralized organization in the transaction of the NEO coin thus making it a decentralized asset. As a native cryptocurrency of the NEO blockchain platform, NEO coin can be used to create and issue tokens of different Dapps created on the NEO platform . NEO coin can also enable different NEO users or developers of different Dapps to hold their NEO coin so that those coins secure the network as well as validate transaction taking place on the NEO platform thus in return they receive reward in form of NEO gas paid by different Dapps .NEO coin projected was started and launched in 2014 as Antshare by Erik Zhang and  Da Hongfei but later came to change its name to NEO. NEO coin has a total maximum supply of 100 million coins. NEO coin conducted its ICO in 2016 at a price of $0.2 per NEO coin. Since then, its price has been tremendously increasing over time due to increase in its mass adoption. Towards the beginning of 2018, NEO coin price was able to go as high as $198 but later drop to $5 towards the end of 2018. Towards the beginning of 2019, its price then started rising again and managed to reach as high as $20. Currently, its price is trading at the range of $10. Its future price analysis can further be explained as follows;

  Factors to consider the  price movement of  NEO coin

NEO future price movement can be considered using several factors like NEO liquidity, Dapps built on its NEO blockchain platform, consensus used  and technical analysis by traders.These factors can be further explained as follows;  

1.    NEO liquidity

As a liquidity,its usage in different platform is being considered . The most commonly platform should be its listing in several exchanges. The more its listing on several exchanges the more it has huge number of community members exchanging it in terms of other cryptocurrencies like bitcoin thus the more stability of its price. On the other hand, the less its listing on several exchanges the less its community members thus the more its volatility. NEO coin can therefore be considered to be more stable and less volatile since it is being listed on several exchanges as follow;

https://www.binance.com/en 

https://www.bitfinex.com/ 

 https://www.hbg.com/en-us/

https://global.bittrex.com/ 

 https://bitsdaq.com/

 https://big.one/

https://www.hbg.com/en-us/ 

 https://www.gate.io/

https://www.bitfinex.com/ 

  https://bitmax.io/#/home 

 https://pro.coinbase.com/

https://www.kraken.com/en-us 

 https://upbit.com/

Based on its liquidity from several list of exchanges above, NEO coin future market price can be predicted for its bullish and bearish market as follows;

NEO bullish condition  

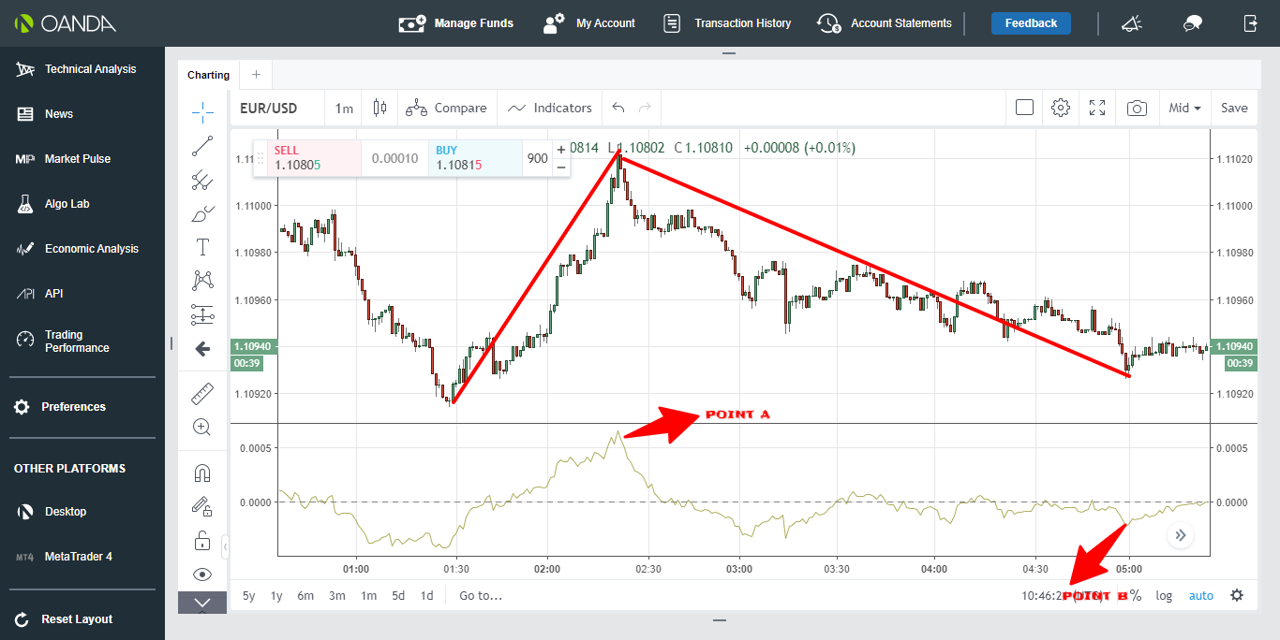
Being much more liquidity of being listed on several exchanges from above, NEO current price is $10.61 . If more exchanges will continue to list NEO coin in their trading platform, this will make NEO coin to become inefficient in its blockchain platform since it will be circulating in several exchanges thus causing its price to increase further. Different developers from different countries developing their Dapps on the NEO platform will have an easy time to transfer their NEO coin earning from the NEO platform to their favorite exchange platform where they will be able to exchange it to their favorite cryptocurrency like bitcoin. Here is how NEO coin price analysis looks like based on an increase on its listing in several exchanges;  

  From the price analysis of NEO coin above, there are two points, A and B. Before point A, the price of NEO coin can be seen to have reached as high as $11.11.Because of its high liquidity, Developers of different Dapps as well as users of those Dapps created on the NEO platform then decide to transfer their earned NEO gas as well as NEO coin being staked to several of these exchanges where they sell them thus causing its price to go a little down  to 10.61. More exchanges then list the NEO coin to their platform thus causing its demand to increase thus the price is expected to move much higher and surpass $11.11 at point B. In months to come the price will keep on going up as new exchanges emerging the market starting to list the NEO coin  

NEO bearish condition

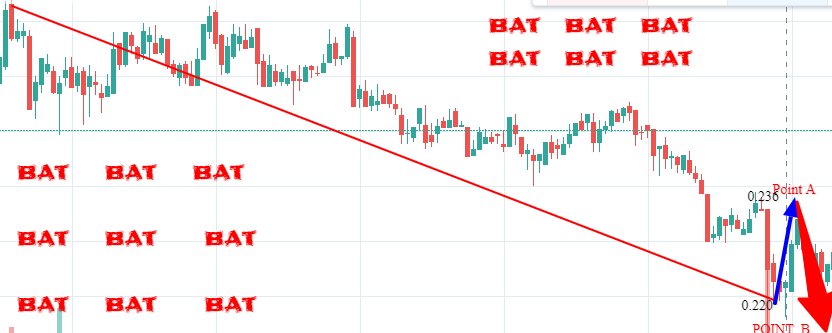
Being much less liquidity for being listed on very few exchanges, NEO coin will become very much volatile thus affecting traders, community members and Dapp developers income. If in months to come, several exchanges start to delist NEO coin in the platform because Dapps in the platform is not adding value to the community members, the quantity of NEO coin will become in excess in its blockchain thus causing its price to decline. Different developers from different countries developing their Dapps on the NEO platform as well as community members of those Dapps will have difficult time to convert their NEO earnings to other cryptocurrencies thus they will end up dumping their coins in the DEX of the NEO thus causing its price to continue dropping further because the coin will become much more volatile. Here is how NEO coin price analysis looks like based on decrease on its listing in several exchanges platform;

From the price analysis of NEO coin above, there are two points, point A and point B. Before point A,the price of NEO coin can be seen to have gone as low as $10.61 from previous high . Because of its low liquidity, developers of Dapps created on NEO platform as well as users of those Dapps over there are dumping their earned NEO gas coin as well as their staked NEO coin to the few exchanges available including the NEO DEX thus causing the NEO coin to become very much volatile thus causing its price to continue dropping further.Some traders in those exchanges are demanding for the NEO coin thus they are buying the coin in those exchanges thus causing its price to increase a little bit all the way to point A at 11.11. Many exchanges have started to lose trust in Dapps created on NEO platform thus they have started to delist NEO coin thus causing the liquidity of NEO coin to decline further thus making it to become much more volatile downwards thus causing its price to keep on declining much further to point B.  With time, NEO coin will end up having no exchange being listed over there thus it will lose its community members thus price will continue to decline further.

2.Dapps built on NEO Blockchain platform  

When NEO coin conducted its ICO in 2016, one NEO coin was going for $0.2. Over a given period of time, the price of one EOS has tremendously managed to go all the way to over $190 in 2018 but later dropped to $5 then later rise again all the way to $20 towards the beginning of 2019. This increase in price has been due to the increase in number of developers using the EOS infrastracture to develop different Dapps, ranging from social media Dapps, publishing platform Dapps, gambling platform Dapps, Defi Dapps and gaming Dapps that benefits users of those Dapps with monetary value. If in the near future these Dapps increase in number then the price will continue to increase while if these Dapps become obsolete on the NEO blockchain network thus they end up looking for other network platform because NEO network is not benefiting them over there, then the price of NEO will drop . Here are some of the Dapps built on NEO blockchain network that are making NEO coin to become a valuable cryptocurrency;

-narrative.org -  a social platform rewarding users and creators

-NEOFISH- a gaming Dapps rewarding game players

-Switcheo- a NEO DEX dapp

-NNS- neo address naming

NEO coin  future market price for period ranging between one month to the whole year based on bullish and bearish condition using the number of Dapps built on its blockchain platform can further be explained as follows;  

  NEO bullish condition

With an increase in the number of Dapps on its platform since its launch in 2014 and relaunch in 2016, NEO coin has seen a tremendous increase in its price from $0.2 during its ICO in 2016 to over $198 in 2018 and back to $20 towards the beginning of 2019. Many developers are keeping on joining the platform to develop their Dapps in different areas which are benefiting their community members thus causing the price to keep on rising. Over the next period of time of over 1 month and above, if the Dapps created on the NEO platform will continue to add value to the community members, then NEO coin will become inefficiency in the market since many users of those Dapps will be acquiring it by using those Dapps thus causing its price to increase much further.At the same time, if the NEO platform will continue to improve their infrastructure, more developers will continue to build on the NEO platform thus causing the NEO coin to keep on increasing in its value since its native NEO gas will be considered as a utility coin by those developers to pay for transaction on the NEO platform.Here is how the future price analysis of NEO looks like based on increase in numbers of developers as well as increase in number of users of Dapps created on the NEO platform;

From the candlesticks chart analysis of NEO future price above, there are two points, A and B. Before point A, the NEO coin price can be seen to have gone as high as $11.11.This increase in price is due to the increase in the number of developers of different Dapps on the NEO platform as well as an increase in the number of users of those Dapps built on the NEO platform. The developers of those Dapps as well as the users of those Dapps will then dump their earned NEO gas as well as staked NEO coin on several listed exchanges thus causing its quantity supplied on those exchanges to reach its maximum point thus pushing its price downwards a bit to point A at 10.61. More developers of NEO platform as well as users of those Dapps on the NEO platform again create a demand for the NEO coin on those exchanges platform so that they use the NEO coin for several task such as buying the token of their Dapps as well as NEO gas and using it to pay transaction on the NEO platform thus causing the price to move further to point B. An increase in the number of developers to build on the NEO platform over a longer period of time like 1 month and above will cause the price of NEO coin to continue increasing much further beyond point B. Also, if the number of users of those Dapps on NEO platform continue increasing, the  price will also continue increasing further to above point B.

  NEO bearish condition

Overtime since the relaunch of NEO  in 2016, its price has been increasing due to an increase in the number of developers on the NEO platform. If NEO platform starts charging high gas fees to different Dapps created on its platform thus causing their income to be affected, these developers will look for another cheap alternative platform that is not affecting their platform.The users of those Dapps will also move together with the Dapp if the Dapp was benefiting them thus reducing the usage of NEO coin and NEO gas. This will cause those Dapp owners as well as users to start dumping the coin in several exchanges at a cheaper price thus causing the NEO coin to lack buyers thus increasing its supply in its blockchain platform. This will cause its price to  decline much further. As more developers keep on looking for a better platform to run their Dapp, the price of NEO will continue to decrease much further since users of those Dapps will also reduce in number on the NEO platform. Here is how the future price analysis of NEO coin looks like based on the decrease in number of developers on the NEO platform as well as decrease in the number of users of those Dapps on the NEO platform;  

From the candlestick chart analysis of the NEO coin price above, there are two points, point A and point B. Before point A, the price of NEO coin can be seen to have gone as low as $10.61.This decrease in price over a given period of time ranging from 1 month to 1 year can be as a result of a decrease in the number of developers of different Dapps on the NEO platform as well as a decrease in the number of usage of those Dapps due to unfavorable conditions such as high gas fee price charged by NEO platform thus income of those created Dapps over there is being affected  thus causing them to look for a favorable condition platform that will not affect their income. Users of those Dapps could also have reduce in number due to shift of those Dapps to other blockchain network platform or because those Dapps have started to become scams.Some developers sell the tokens of Dapps  to get NEO coin thus causing its price to move upward to point A a little bit at 11.11. If more Dapps withdraw themselves from the NEO platform,they will also cause the user to go with them to the favorable platform where they will go thus decreasing NEO coin usage thus causing it supply to increase in its blockchain platform thus causing its price to continue declining further to point B

3. Consensus used

Different cryptocurrencies used different consensus to release their coin to their blockchain so that those taking part in securing the network can be rewarded for validating the new blocks of the new amount of coin added to the blockchain plus the fees for validating transactions. Some of the commonly known consensus used by most know cryptocurrencies are proof-of-work consensus, proof-of-stake consensus, delegated-proof-of stake consensus and proof-of-capacity consensus. NEO coin uses proof-of-stake consensus to reward those taking part in leasing their coins to secure the NEO network. Since all NEO coins were released to its blockchain, there is NEO gas which is being released to its blockchain as well as the one used to pay for transaction cost thus stakers of NEO coin get rewarded for locking their NEO coin for a given period of time to secure the NEO network as well as to validate transaction taking place on the NEO network. In order to be entitled to receive NEO gas, you have to stake some amount of NEO coin. The more NEO coin you stake the more NEO gas you receive. Using the concept of consensus used, the future market price of NEO coin based on bullish and bearish market condition can further be explained as follows;

NEO bullish condition

Since NEO platform introduced its concept of staking to reward those locking their coins for a given period of time so that those coins can be used to secure the network and to validate new block added to the NEO platform, more users have started to purchase the coin in several exchanges so that they can lock them to the NEO staking pool.This increase in number of users staking the coin to receive reward in form of NEO gas has caused the NEO coin to become inefficiency in several exchanges thus causing its price to increase. In the near future, if the reward increases, more users will buy more NEO coin in several exchanges thus causing it to become much more inefficiency thus causing its price to increase much further. Here is how the future market price for NEO coin looks like based on an increase in the amount of NEO being staked over time due to an increase in its reward to stakers;

From the candlesticks chart above of the future price analysis of NEO coin, there are two points, point A and B. Before point A, the price of NEO coin can be seen to have gone as high as $11.11. This increase in price is as a result of an increase in the amount of NEO coin being staked due to an increase in the amount of reward in form of NEO gas. Some stakers then unstake their NEO coin as well as reward and dump them in several exchanges in terms of other cryptocurrencies thus causing its price to move a little bit downwards to point A at $10.61.More stakers then purchase the NEO coin in several exchanges and take them to the staking pool to lock them over there so that they secure the network thus causing the NEO coin to become inefficiency again thus creating a demand for it again thus causing its price to move further to point B again. If more stakers continue to purchase the NEO coin in several exchanges in the near future so that they unlock them so that they can be entitled to receive reward in form of NEO gas, then the NEO coin will further move beyond point B .

NEO bearish condition

Since NEO platform introduced its concept of staking to reward those locking their coins for a given period of time so that those coins can be used to secure the network and to validate new block added to the NEO platform, more users have started to purchase the coin in several exchanges so that they can lock them to the NEO staking pool.If in the near Future the reward start declining due to some other factors like some Dapps withdrawing themselves from the NEO platform due to high fees charged or block reward being reduced, then these stakers will start unlocking their staked coin from the NEO staking pool and sell them in several exchanges thus causing its supply in those exchanges to increase thus causing its price to decrease. As more stakers are keeping on unlocking their coins because of a decline in its reward program, its NEO coin will become in excess in several exchanges thus causing its price to continue declining further. Here is how the future market price for NEO coin looks like based on a decrease in number of stakers due to a decrease in its reward;

From the candlesticks chart above of the future price analysis of NEO coin, there are two points, point A and B. Before point A, the price of NEO coin can be seen to have gone as low as $11.11. This decrease in price is as a result of a decrease in the amount of NEO coin being staked due to a decrease in the amount of reward in form of NEO gas. Some stakers then purchase the NEO coin  in exchanges to stake due to increase in reward  thus causing its price to move a little bit upwards to point A at $11.11.More stakers then unlock their NEO coin in staking pool as well as rewards received, taking  them for sale to several exchanges because of a decrease in its reward thus causing the NEO coin to become in surplus in those exchanges  again thus causing its price to move further to point B again. If more stakers continue to unlock their NEO coin together with their reward to take them for sell in several exchanges due to decrease in its reward in the near future then the NEO coin will further move beyond point B .

  4.Technical Analysis by traders

Most traders use technical analysis tools to analyse the direction of the cryptocurrencies market. There are hundreds of technical analysis tools used by different trades since different technical analysis tools work for different traders in different ways. Technical analysis tool can either be a trend indicator or an oscillator indicator.The most commonly used trend and oscillator indicator tool by most traders is moving average and Relative strength index indicator. Moving average indicator works on the basis of support and resistance while Relative strength index indicator works on the basis of overbought and oversold in the market. To analyze the future price of NEO coin in months to come ,we will use relative strength indicator to indicate whether the NEO coin will become bullish or in bearish condition based on the behaviour of traders. NEO coin future market price based on technical analysis for bullish and bearish is further explained as follows;  

NEO Bullish condition

using RSI, NEO coin will be considered to be in a bullish condition when the candlesticks chart are moving in an upward market direction. RSI indicator will help traders to know whether the market has become in an overbought market condition so that they exit for a shorter period of time and enter again when the overbought market condition is over. In overbought market condition, the RSI will rise above 70. This is indicated as from the NEO coin future market price analysis candlesticks chart from below;  

From the NEO coin future market price candlesticks chart above, there are three points, point A ,B and C. Initially as you can see, the NEO market has been in a bullish condition over a given period of time. At point A, the RSI rises above 70 thus signaling NEO traders that the buyers has exceeded the sellers thus possibility of it reversing back downwards. Most NEO traders who were holding NEO coin then decided to sell them which results to sellers pressure pushing the NEO price downwards to point B at price $10.61. More sellers entered the market thus causing the market to become oversold again thus it is being pushed further to point C. If this continues in one month time, then the NEO price will continue to move upwards further.  

NEO bearish condition using RSI

NEO coin will be considered to be in a bearish condition when the candlesticks chart are moving in a downwards market direction. RSI indicator will help traders to know whether the market has become in an oversold market condition so that they exit for a shorter period of time and enter again when the oversold market condition is over. In oversold market condition, the RSI will fall below 30. This is indicated as from the NEO future market price analysis candlesticks chart from below;

From the NEO future market price candlesticks chart above, there are three points, point A ,B and C. Initially as you can see, the NEO market has been in a bearish condition over a given period of time. At point A, the RSI falls below 30 thus signaling NEO traders that the sellers have exceeded the buyers thus possibility of it reversing back upwards. Most NEO traders who were selling their NEO coin then decided to buy them which results to buyers preasure pushing the NEO price upwards to point B at price $11.11. More buyers entered the market thus causing the market to become overbought again thus it is being pushed further to point C. If this continues in one month time, then the NEO price will continue to move downwards further.  

summary

1.The more liquidity NEO coin becomes the more likely its price will continue to rise while the less liquidity it becomes the more likely its price will continue to decline

2.An increase in the number of Dapps in the NEO platform will result to an increase in the price of NEO while a decrease in the number of Dapps in the NEO platform will result to a decrease in its price over time

3.An increase in the number of NEO stakers due to an increase in its reward will cause NEO coin to become ineffeciency thus resulting to an increase in its price while a decrease in the number of NEO stakers due to a decrease in its reward will cause NEO coin to become surplus thus resulting to a decrease in its price.

4.When more traders are buying the NEO coin, they are creating a downwards preasure thus causing its price to decline further so that the NEO makret can profit with a few number of sellers while when more traders are selling the NEO coin,they are creating an upwards preasure thus causing its price to incline further so that the NEO market can profit with few number of buyers

Donchian channels is a trend following indicator.

Being a trend following indicator, Donchian channels was created by Richard  Donchian with the main objective of helping traders identify the volatility of the market thus knowing whether the market has gained support or resistance. Donchian channels is considered to be much more the same to bollinger band to the fact that it also has 3 bands,the upper band, the lower band and the middle band.The upper band represents the highest high price over a given n period while the lower band represents the lowest low price over a given n period.The middle band represents the average of the upper and lower band and is used to identify the price breakout.

According to Richard Donchian, the values of Donchian channels is derived using the formula as follows;

middle band\=(upper band + lower band)/2

upper band\= highest high over a given n period

lower band \= lowest low over a given n period

Since donchian channel is a trend following indicator and it has 3 bands, upper band, middle band and lower band, it therefore follows that when the price rises above the upper band that will be an indication of an upward market movement thus the trader should be trading in an upward market direction.If the price rises above the highest high of the upper band, the trader should close any long position since that will be an indication of a resistance point over there.On the other hand, if the price falls below the lower band that will be an indication of a downward market movement thus the trader should be trading in a downward market direction.If the price falls below the lowest low of the lower band,the trader should close any short position since that will be an indication of a support point over there. This is indicated as from the candle sticks chart below;

From the candle sticks chart above, there are 5 points, point A, B, C, D and E. Point A and E represent the breakout points while point B and C represent upper band and lower band respectively. Point D represent the midlle band which is used to indicate occurrence of breakout points.

Initially, at point A the price falls below the lowest low of the lower band thus indicating a support point  at that point thus signaling the trader to exit any sell position . Later on, the price rises above the upper band thus signaling the trader to open a buy position since the market is starting an upward trend.

On the other hand, at point E, the price had initially risen above highest high of the upper band thus indicating a resistance point at that point thus signaling the trader to exit any buy position. Later on, the price falls below the lower band thus signaling the trader to open a sell position since the market is starting a downward trend.

Recommendation:If you are a day trader just use 1 min, 5 min, 15 min and 30 min timeframe while if you are a swing trader just use 1 hour and above timeframe if you want donchian channels indicator to work well for you.

skrill donation:mudigoomondi@gmail.com

Neteller donation:mudigoomondi@gmail.com

Bitcoin:1Fp5aLgRB6WJnC7nxGw57M3JbbexaAWHG2

Ethereum; 0x346570c491b76c7cd51699bdd272762111b743a9

Litecoin: LeEH7B82ccXJ6QoibCryGJNpDGNx2x77fL

Dogecoin: DLShs2vqhMc1ggqo8MPPMBTcPAZdqCZoWd

lightning network:tipping.me:https://tippin.me/@quintomudigo

MA cross is a crossover trend indicator.

Being a crossover trend indicator, MA cross was mainly created to enable traders to know whether the market has gained support or resistance. As a crossover trend indicator, MA cross has two moving average crossover lines, the short term moving average ( indicated by red line) and the long term moving average(indicated by blue line). Short term moving average represents the price while long term moving average represents the moving average.

Therefore, since MA cross is based on the crossover, it, therefore, follows that when the short term moving average crosses above the long-term moving average from below then that will be an indication of support point  thus the trader should be trading upwards. On the other hand, when the short term moving average crosses below the long-term moving average from above,that will be an indication of a resistance point thus the trader should be trading downwards. This is indicated as from the candlesticks chart below;

From the candlesticks chart above, there are 4 points, point A, B, C and D. Point A, and B represent the crossovers points while point C is the long-term moving average and is blue in color. Point D represents the short term Moving average and is red in color.At point A, the short-term MA has crossed below the long-term MA from above thus an indication of a resistance point over there. This will signal the trader to be trading in a downwards market direction from point A since the market is starting to move downwards. On the other hand, at point B, the short-term MA has crossed above the long-term MA thus an indication of a support point over there . This will signal the trader to be trading in an upwards market direction from point B 

Recommendation:If you are a day trader just use 1 min, 5 min, 15 min and 30 min timeframe while if you are a swing trader just use 1 hour and above timeframe if you want MA cross indicator to work well for you.

skrill donation:mudigoomondi@gmail.com

Neteller donation:mudigoomondi@gmail.com

Bitcoin:1Fp5aLgRB6WJnC7nxGw57M3JbbexaAWHG2

Ethereum; 0x346570c491b76c7cd51699bdd272762111b743a9

Litecoin: LeEH7B82ccXJ6QoibCryGJNpDGNx2x77fL

Dogecoin: DLShs2vqhMc1ggqo8MPPMBTcPAZdqCZoWd

lightning network:tipping.me:https://tippin.me/@quintomudigo

          RSI is an oscillator indicator while moving average is a trend indicator. Today being Thursday october the 31st of 2019, the EUR/USD market has been in a bullish trend most of the time.EUR/USD market has managed to rise above 1.1170. The question is will this bullish trend continues or will the EUR/USD market reverse and become a bearish trend. This is indicated from the candlesticks chart below;  

    From the candlesticks chart above, there is point A which is located along the RSI and point B located along the moving average. Although the EUR/USD market has been in a bullish trend most of the time and we don't know whether the EUR/USD market will continue to be in this bullish condition or it will reverse and become a bearish trend, we can use the concept of RSI and moving average to predict the direction of the EUR/USD market for the remaining time.  

Concept of RSI

Using the concept of RSI, the market is normally considered to be overbought if the RSI rises above 70 and oversold if the RSI falls below 30. At point A, the RSI has risen above 70 thus an indication of an overbought EUR/USD market condition. Although the EUR/USD market has been bullish today and managed to rise above 1.1170, we can decide to follow the concept of RSI and open a sell position because at above 70, that is an indication of an overbought market condition thus the EUR/USD market will reverse and start downwards trend.

  Concept Of Moving Average

Using the concept of moving average ,the market is considered to experience a reversal trend if the price rises above the highest high of a moving average or falls below the lowest low of a moving average.At point B, the price has risen above the highest high of a moving average thus a downward reversal trend has started to take place. Although today the EUR/USD market has been in a bullish trend and managed to rise above 1.1170, We can decide to follow the concept of moving average because the price has risen above the highest high of a moving average and open a sell position. Here is how our trading idea for EUR/USD  sell market looks like today;

  SELL 1.1170    T/P 1.1120  S/L  1.1240  

Make sure to apply risk management while opening your position because this is not an investment advice but just a trading idea

RSI is an oscillator indicator while moving average is a trend indicator.

Today being Tuesday october the 29th of 2019, the EUR/USD market has been in a bullish trend most of the time.EUR/USD market has managed to rise above 1.11051. The question is will this bullish trend continues or will the EUR/USD market reverse and become a bearish trend. This is indicated from the candlesticks chart below;

From the candlesticks chart above, there is point A which is located along the RSI and point B located along the moving average. Although the EUR/USD market has been in a bullish trend most of the time and we don't know whether the EUR/USD market will continue to be in this bullish condition or it will reverse and become a bearish trend, we can use the concept of RSI and moving average to predict the direction of the EUR/USD market for the remaining time.

Concept of RSI

Using the concept of RSI, the market is normally considered to be overbought if the RSI rises above 70 and oversold if the RSI falls below 30. At point A, the RSI has risen above 70 thus an indication of an overbought EUR/USD market condition. Although the EUR/USD market has been bullish today and managed to rise above 1.11051, we can decide to follow the concept of RSI and open a sell position because at above 70, that is an indication of an overbought market condition thus the EUR/USD market will reverse and start downwards trend.

Concept Of Moving Average

Using the concept of moving average ,the market is considered to experience a reversal trend if the price rises above the highest high of a moving average or falls below the lowest low of a moving average.At point B, the price has risen above the highest high of a moving average thus a downward reversal trend has started to take place. Although today the EUR/USD market has been in a bullish trend and managed to rise above 1.11051, We can decide to follow the concept of moving average because the price has risen above the highest high of a moving average and open a sell position.

Here is how our trading idea for EUR/USD sell market looks like today;

SELL 1.11051 T/P 1.10551 S/L 1.11701

Make sure to apply risk management while opening your position because this is not an investment advice but just a trading idea

Detrend price oscillator is an oscillator indicator.

Being an oscillator indicator, Detrend price oscillator was mainly created to enable traders to know whether the market is in an overbought or oversold condition by  removing the long term trends from the short one thus focusing on price movement  using a displaced simple moving average.By using a displaced moving average, detrend price oscillator will be considered to be an oscillator with an oscillation at point 0.00. Just like other trading indicators, detrend price oscillator is also based on centerline and divergence. The values of detrend price oscillator is further gotten using the formula as follows;

Detrend price oscillator\= closing price -SMA of{(n/2)+1} 

where n is number of period

Detrend price oscillator can further be explained using centerline(overbought and oversold) and divergence as follows;

Concept of centerline(overbought and oversold)

Since Detrend price oscillator is based on the centerline, it, therefore, follows that when the detrend price oscillator crosses above 0.00, that will be an indication of an upward market movement thus the trader should be trading upwards while when the detrend price oscillator crosses below 0.00, that will be an indication of a downward market movement thus the trader should be trading downwards. When the dentrend price oscillator falls further below -0.0002 that will be an indication of an oversold market condition thus signaling the trader to close any sell position and opens a buy position since the market will start an upward trend.On the other hand, for upward market trend, when the detrend price oscillator rises further to above 0.0002, that will be an indication of an overbought market condition thus signaling the trader to close any buy position and opens a sell position since the market will start moving downwards. This is indicated as from the candlesticks chart below;

From the candlesticks chart above, there are two points, point A and point B. At point A, the detrend price oscillator has risen above 0.0002 thus an indication of an overbought market condition at that point.This will signal the trader to close any buy position and open a sell position since the market is starting to move in a downward direction at that point.On the other hand ,at point B, the detrend price oscillator has fallen below -0.0002 thus an indication of an oversold market condition at that point.This signals the trader to close any sell position and opens a buy position since the market is starting to move upward at that point

concept of divergence

Also, since detrend price oscillator is also based on divergence, it, therefore, follows that when the detrend price oscillator is moving downwards at above 0.00 while the price is moving upwards, the price will reverse and start moving downwards in the same direction as the detrended price oscillator.On the other hand, when the detrend price oscillator is moving upwards at below 0.00, while the price is moving downwards, the price will reverse and start moving upwards in the same direction as the detrended price oscillator. This is indicated as in the candlesticks below;

From the candlesticks chart above, there are 3 points, point A, B and C. Point A and B are the divergence points while point C represents the detrended price oscillator.At point A, the market was moving upwards while the detrended price oscillator was moving downwards at above 0.00. This was an indication of an overbought market condition at point A thus the market reversed and start moving downwards in the same direction as the detrended price oscillator. This will signal the trader to close any buy position and open a sell position.On the other hand at point B, the market was moving downwards while the detrended price oscillator was moving upwards at below 0.00. This was an indication of an oversold market condition at point B thus the market reversed and start moving upwards in the same direction as the detrended price oscillator.

Recommendation:If you are a day trader just use 1 min,5 min, 15 min and 30 min timeframe while if you are a swing trader just use 1 hour and above timeframe if you want detrended price oscillator to work well for you.

If you would like to support our work, here is our tipping details;

skrill donation:mudigoomondi@gmail.com

Neteller donation:mudigoomondi@gmail.com

Bitcoin:1Fp5aLgRB6WJnC7nxGw57M3JbbexaAWHG2

Ethereum; 0x346570c491b76c7cd51699bdd272762111b743a9

Litecoin: LeEH7B82ccXJ6QoibCryGJNpDGNx2x77fL

Dogecoin: DLShs2vqhMc1ggqo8MPPMBTcPAZdqCZoWd

lightning network:tipping.me: https://tippin.me/@quintomudigo

Bytom coin is a native cryptocurrency of the Bytom blockchain platform launched on the Ethereum network as an ERC20 but was later created on the Bytom blockchain network platform whose transaction takes place from one peer to another without involvement by the government thus is being considered to be a decentralized asset. Bytom coin was mainly created to enable assets from the side chain to be able to communicate with those assets on the main . Bytom coin also allow assets from other blockchain to be able to interact with those assets from the main chain.Bytom coin can also be used to enable different companies created on Bytom platform to be able to issue the dividend earned to several share holders of those companies. Different Dapps created on Bytom network can also use Bytom coin to pay for transaction of those Dapps while running over there as well as to use the coin to create and issue the token of their created Dapps. Bytom coin can also be used to pay for transaction for transferring Bytom coin from one smart contract address to another as well as for swapping the issued tokens on the platform to Bytom coin. Miners of Bytom coin can also use the Bytom coin to purchase different mining hardware. Since Bytom has another third layer, stakers can also stake the Bytom coin on the Bystack so that those coins are used to secure the Bytom network much further thus in return they also receive reward for that.

Bytom transaction 

Bytom transaction takes place on the Bytom blockchain explorer based on block height and timestamp.  Here is a view of the Bytom transaction;

To view how the Bytom transaction takes place on the Bytom blockchain, you can follow the link below;

https://blockmeta.com/

Date Launched

 Bytom coin project was started  and launched in 2018 with the main objective of allowing assets from the main chain to be able to interact with those assets from the side chain as well as with those assets of other blockchain

Founder Of Bytom coin

Bytom coin was created by Duan Xinxing who is a china based blockchain technologist and was later joined by another cofounder Chang Jia who is the creator of the chinese largest cryptocurrency news, 8btc. Their main motive for creating Bytom coin was to solve the problem of scalability where they were able to make the blockchain of the coin to have three layers, the layer for creating Dapps, the layer for issuing other tokens and the layer for recording transaction thus making it a very much secured coin.

Process of creating Bytom coin

  Just like other cryptocurrencies like bitcoin and Ethereum, most of the Bytom coin is  released through the mining process using electricity power ,internet connection and computing power of GPU and ASICS hardware. The algorithm used in the mining process is Tensority. After every 2 minute, 412 coins is being added to the Bytom network which is shared among the miners. The key participants are ; miners and mining pool. The miners can either choose to become solo miner which is less rewarding or can join a mining pool which is more rewarding. As a miner on the mining pool, the more computing power of GPU or ASICS you share the more reward you receive. The new coins added on the Bytom block as well as the fees charged in verifying any block transaction on the Bytom network will be shared to all miners based on the computing power they share. Here is how the Bytom mining process looks like;

If you want to become a miner so that your GPU computing power can be used to validate transactions added on the Bytom network thus securing the network, then you can pool your power from below;

https://pool.viabtc.com/

Since bytom added a new layer called vapor in order to make the Bytom network much more secured, it was able to become a proof of stake also. As a proof of stake coin, the two key participants are the stakers and block producers. The role of the stakers will be to lease at least 2 Bytom coin to any of the verified block producer thus in return they will be able to receive reward of up to 5% the whole year. The more you stake the more reward you receive. As a block producer, you need to have atleast 1,000,000 coin in your staking wallet and  a 24 hour internet connection. As a block producer, you will use the leased coin to verify any block added to the network thus you receive the transaction fees which will be distributed to several stakers based on their staking amount. The maximum number of block producers to take part on this is 36 while the minimum amount of period that you should lock your coin to any of these block producer so that you can be entitled to receive reward should be 20 days. Here is how the staking process looks like;

    If you want to lease your coin to any of the verified producer so that they can use your coin to secure the network much further thus in return you receive reward, then you can join them from below;

https://www.bystack.com/

Maximum circulation of Bytom

  The maximum amount of Bytom coin that should be circulating in its Bytom blockchain network upon completion of its mining process should be 2.1 billion coins. During its launch, 147 million coins were issued to private investors while another 630 million coins were premined to cater for those investors who took part in its ICO .Another 420 million coins were reserved by the Bytom foundation while another 210 million coins was set aside to cater for the development of Bytom project.The remaining 693 million coins is the one which will be released through the mining process whose reward will keep on halving after every 4 years. Here is how the Bytom supply distribution looks like;

Bytom  Price

Currently, 1 Bytom is worth more than $0.05 and its price is expected to increase over the next period of time. Bytom is being abbreviated as  BTM.

    Converting my Bytom  to other cryptocurrencies

To convert your Bytom to other cryptocurrencies such as bitcoin and Ethereum, you need to have a cryptocurrency exchange account. If you don't own one then you can follow the link to open a cryptocurrency exchange account for easy conversion of your Bytom to Bitcoin or Ethereum. Here is a list of exchanges where you can easily exchange your Bytom to your favorite cryptocurrencies;  

https://www.hbg.com

https://www.okex.com/

https://international.bittrex.com/

 https://www.gate.io/

https://www.bitmart.com/

 https://www.bibox.com/

https://hitbtc.com/ 

 https://www.bw.com/

https://www.coinex.com/

 https://www.kucoin.com/

  Storing my Bytom coin

To store your Bytom coin, you need a Bytom wallet. You can either store online or offline. To store your Bytom coin online, you can either use Cobowallet,Byone wallet,bycoin or can download the Bytom wallet for windows, IOS or for linux. To securely store your Bytom coin offline from being stolen by hackers, you can use hardware wallets such as ledger nano and bepal.

Transferring my  Bytom coin to other Users

If you want to transfer your Bytom coin to another user, the two of you must have trust in each other. The trust should be the Bytom coin address provided for by the receiver while the sender must have the Bytom coin balance in their account to send to the receiver. For the sender, a blank space to insert the receiver address and another blank space to insert the amount to send to the receiver is indicated. Here is how it looks like;  

Knowing more About Bytom coin

If you feel that you need to learn more about Bytom coin, then you can follow them on their site. Here is the link redirecting you to Bytom coin platform website 

https://bytom.io/

  You can as well read their white paper to learn more about their idea from below

https://whitepaper.io/document/18/bytom-whitepaper

You can also join as a community member in any of their social media platform from below to follow the discussion made by other community members;

Telegram:https://t.me/BytomInternational

twitter:https://twitter.com/Bytom_Official

Reddit:https://www.reddit.com/r/bytomchain/

discordapp:https://discordapp.com/invite/U3RSYr5

facebook:https://www.facebook.com/bytomofficial/

Now that you know, I think that it is time for you to start earning some Bytom coin  through mining by simply sharing your CPU or GPU computing power to any of the verified bytom mining pool to add new block to the network and to secure the network. You can as well stake your bytom coin to bystack so that your coin provide a top layer security to bytom network.As a miner, the more CPU or GPU computing power you share the more reward you receive from the mining pool while as a staker, the more coins you lease to secure the bytom network the more reward you receive.If you feel that we should also own some Bytom coin for simply helping you know about it, then here is our Bytom coin address; bm1qla62y95m502cdsx22vhyaffdt30zyxxa3euf6s