Metal coin is a native cryptocurrency created on Ethereum blockchain network platform whose transaction takes place from one peer to another without involvement by the government thus is being considered to be a decentralized asset. Metal coin is a proof of processing coin thus most of it will be released when a sender sends different cryptocurrencies to a receiver. Metal coin was also created to become a native coin of the metal pay, an online processing transfer payment thus allowing merchants and merchants customers to be able to receive discount by purchasing the coin to pay for different service. As a native coin of metal pay, metal coin was also created to disrupt the online processing transfer payments like neteller, paypal and alipay. As a disrupter in the online processing payment, metal coin Links two participant in its network, that is: The sender and the receiver. The sender will be responsible for creating transaction thus in return both of them receive reward. As a sender, you can choose to become a solo sender or a merchant sender. As a solo sender, you will be receiving less reward compared to a merchant sender. In order to be entitled to receive reward while sending money to other users, you need to be verified. Your identity documents need to be matching with your details on the metal pay platform so that when payment is being processed, the matching will be able to be validated thus in return you receive metal coins to your wallet.
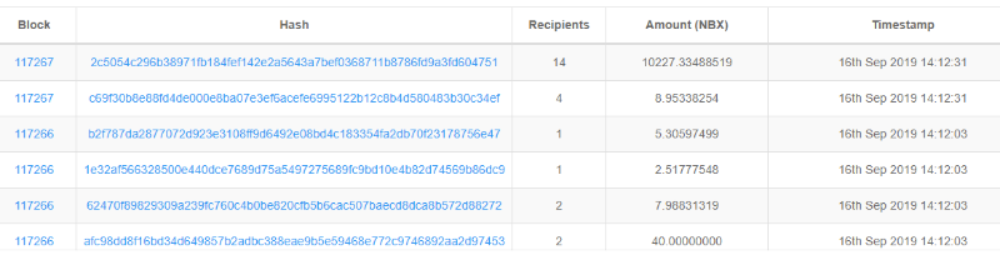
Metal coin transaction
Metal coin transaction takes place on the Ethereum blockchain explorer based on block height and timestamp. Here is a view of Metal coin
transaction;

To view how the transaction takes place at Ethereum blockchain explorer, simply follow the link below;
https://etherscan.io/token/0xF433089366899D83a9f26A773D59ec7eCF30355e
Date Launched
Metal coin project was launched in 2017 with the main objective of distrupting the online transfer payment system. Metal coin was created to become a native coin for metal pay platform thus allowing senders and receivers to earn metal coin for simply transfering different cryptocurrencies between themselves. In order for each party to receive the metal coin reward, they are supposed to be verified members for easy matching of their data when the transaction is being processed.
Founder Of Metal coin
Metal coin was created by a teenager boy, Erik Finman with the main objective of rewarding users for sending different cryptocurrencies to their peer or by sending fiat money to their bank account via the metal pay platform. Erik Finman wanted to ensure that a proof of processing transaction takes place thus preventing money laundering activity process.By doing so, Erik Finman wanted to make sure that there is matching of data of the sender of the money on the metal pay platform.
Process of creating Metal coin
Unlike cryptocurrencies like bitcoin and Ethereum which are released through the mining process using power supply and internet, for Metal coin, that is not the case . Instead,instead, metal coin was created to become a proof-of-processing coin. As proof of processing coin, most of metal coins which was created from genesis block is being released to Ethereum blockchain network when the sender sends different cryptocurrencies to other users or when they send their fiat money to their bank account. During its launch, 66,588,888 coins were created from the genesis block on Ethereum network. Out of this amount, 60.44% were distributed to early investors, founding team members and to the company operational activity while the remaining 39.56% will be released through proof of processing activity. In the proof of processing activity, the sender and the receiver should ensure that their identity document is matching to their data on the metal pay platform so that they be eligible to receive reward. For every transaction processed, the sender and receiver will share 10% of the transaction cost equally that there is matching of their data when proof of processing is being verified. This reward will be return to their account in form of metal coin at current price. Let say that when the transaction carried out cost $20. 10% of this will be $0.2. If at that time of transaction, the metal coin is being worth at $0.5, then each one of them will receive 0.2 metal. Here is a view of metal coin reward process;

If you want to start earn money for sending to other users as well as receiving from sender then you can join them from below
https://www.metalpay.com/
Maximum circulation of metal coin
The maximum amount of metal coin that is expected to be circulating in Ethereum blockchain network should be 66,588,888 coins. All this amount were created from the Ethereum network. Out of this amount, 21,088,888 coins were set aside for sale while another 3,378,000 were set aside to the founding team of metal pay. Another 13,378,888 coins were set aside to be used for company's operational activity while the remaining amount of 26,341,112 is the one that will be released through the proof of processing activity between senders and receivers. Here is how the metal coin supply distribution looks like;

Metal coin Price
Currently, 1 Metal coin is worth more than $0.3 and its price is expected to increase over the next period of time. Metal coin is being abbreviated as MTL.
Converting my Metal coin to other cryptocurrencies
To convert your Metal coin to other cryptocurrencies such as bitcoin and Ethereum, you need to have a cryptocurrency exchange account. If you don't own one then you can follow the link to open a cryptocurrency exchange account for easy conversion of your Metal coin to Bitcoin or Ethereum. Here is a list of exchanges where you can easily exchange your Metal coin to your favorite cryptocurrencies;
https://www.binance.com/en
https://www.bittrex.com
https://www.hbg.com/en-us/
https://hitbtc.com/
https://www.livecoin.net/en
https://www.bancor.network/
Storing my metal coin
To store your Metal coin, you need a metal coin wallet that is compatible to ERC20 tokens . You can either store online or offline. To store your metal coin online, you can either use myetherwallet or metamask or can download the metal pay app. To secure your metal coin from being stolen by hackers, you can use ledger nano wallet
Transferring my metal coin to other Users
If you want to transfer your metal coin to another user, the two of you must have trust in each other. The trust should be the metal coin address provided for by the receiver while the sender must have the Metal coin balance in their account to send to the receiver. For the sender, a blank space to insert receiver address and another blank space to insert the amount to send to the receiver is indicated. Here is how it looks like;


Knowing more About Metal coin
If you feel that you need to learn more about Metal coin cryptocurrency, then you can follow them on their site. Here is the link redirecting you to Metal coin platform website
https://www.metalpay.com/
Now that you know, I think that it is time for you to start earning some Metal coin simply by sending different cryptocurrencies to other users or by sending fiat money to different bank accounts . The more transactions you process the more metal coins you earn. If you feel that I should also own some Metal coin for helping you to know about it then here is my metal coin address that is compatible to ERC20; 0x346570c491b76c7cd51699bdd272762111b743a9