hightopo

In today’s challenging energy market hydropower operators face multiple challenges such as increasing price pressure with the rise of intermittent renewable energy, tighter regulations, ageing assets, experienced workforce turnover, new operating patterns, staff retention in remote locations, etc. Fortunately, digital technologies can help turn these challenges into opportunities, putting hydropower at the forefront of the energy transition.

Hightopo developed a powerful web-based 2D and 3D rendering engine which provides rich display effects for data visualization. With this, we provide hydro industry business with a lightweight, cross-platform, responsive, fully interactive digital twin solution. Helping the hydro industry land for a smooth digital transformation, utilizing the powerful 3d rendering engine and detailed and beautiful 3d models, we empower dam operators with an institutive and immersive visualization experience.

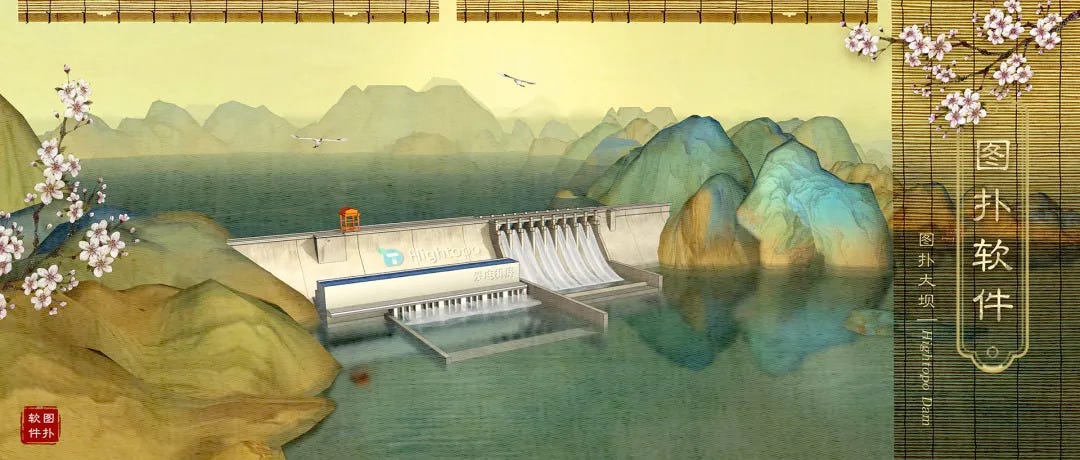
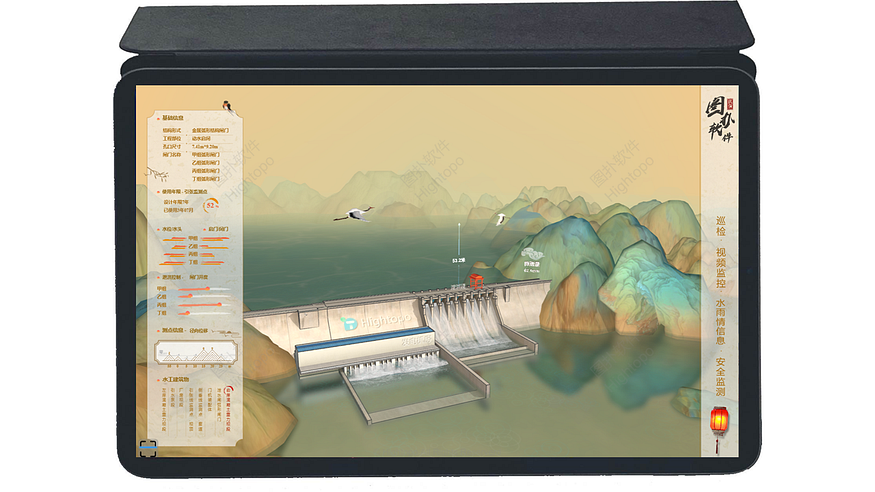
Different from the previous digital twin projects in sci-fi style, this dam visualization project adopts the poetic and painting style of ink painting and classical music and presents serious and boring projects through traditional Chinese ink paintings with profound artistic conception.

3D Walkthrough

HT powerful 3d rendering engine easily achieves 360-degree panoramic view. Get the virtual inspection and roam the entire water conservancy equipment from the flying perspective of the crane in the scene.

Safety Monitoring and Instrumentation

Dam Safety Monitoring and Instrumentation is a process of monitoring the condition of a dam to ensure public safety and the ongoing viable service of the dam to the community and industry.

The major areas that require monitoring are,

  • leakage, deformation, pore pressure (seepage line) and response to earthquakes.

Instruments that are used for monitoring the following parameters:

  • Leakage or seepage losses: V-notch weirs, drainage holes;
  • Deformation (concrete): plumb lines and external reference points;
  • Deformation (embankment): differential settlement gauges and external reference points;
  • Uplift pressure: piezometer
  • Earthquake: seismograph

The most important parameter for monitoring is leakage from the foundation rock. Following the initial filling of a newly constructed dam and when the dam level has stabilised at a constant level, then leakage is considered to be stable if the rate of leakage decreases gradually. If the rate of leakage is observed to gradually increase then the cause must be investigated. If the leakage rate increases abruptly, then this must trigger an urgent investigation.

Video Surveillance Integration

HT is a component library based on the HTML5 standard, which can seamlessly integrate various multimedia functions of HTML5 and support the integration of various video resources to form a unified video access platform. It can mark camera objects on a 2D or 3D map and associate its video signal source. The corresponding surveillance video can be retrieved by interacting in the scene.

Interaction on 3D Scene

  • Drag the control panel on the left side to control the waterfall speed.
  • Click the construction panel on the left side to switch the view to different dam construction.
  • Click the dancing swallow to play/pause background music

BIM + GIS Leveraging Digital Twin

At present, most engineering and construction structures, inspection records, the monitoring information can not be associated with the actual spatial location. Only the seasoned veterans can fast and accurately find the related information. However, 3D visualization, BIM technology and GIS, bring great convenience to water conservancy dam management.

  • Lightweight BIM

BIM model file is generally large and heavy, it is not conducive to running directly in the browser. HT offers an advanced feature to lightweight the BIM model, enable faster loading on the web.

  • Utilizing GIS

GIS provides more information about terrain, buildings, facilities, etc. By superimposing and fusing multi-source data such as oblique photography data, vector data, 3D model data, and BIM data, GIS can organically combine the spatial location of objects in the real world with related attributes, thereby providing technical support for spatial decision-making and realizing visual expression. HT provides GIS integration and other related services to realize the 3D display of dam terrain scene data and further assist the visualization process of water conservancy dam projects.

Web Display / VR Supported

HT 3D visualization is a B/S (Browser / Server mode) structure application. with the lightweight models, users can access the project through any modern browser, from a PC, Pad, or smartphone, it just works seamlessly anywhere and any time and enable remote monitoring and management. Furthermore, HT visualization solution is VR supported, users can access the scene through VR devices, empower the hydro industry to manage and monitoring assets in an immersive way.

Conclusion

Dam safety monitoring and visualization are crucial for the hydro industry. Through the visualization of information, operation and maintenance managers can obtain first-hand information more intuitively and concretely, analyze the operation status of the dam and bedrock, and grasp the working form of the dam. Evaluate the safety status of the dam and provide evidence for finding abnormal signs of the dam.

Hightopo 3D visualization solution empowers the hydro industry to clearly and quickly locate monitoring equipment and facilities, and timely obtain basic monitoring information of relevant measuring points.

With more than 10 years of industry experience, Hightopo has collaborated with more than 1000 clients from various industries. From water conservancy, power, energy and other fields, Hightopo empowers industries for a smooth digital transformation.

Tokyo Olympics draw to a close this Sunday night after more than two weeks of competitions held amid extraordinary restrictions and mostly behind closed doors. The pandemic Olympics give us a thought, how we should improve stadium management? One of the answers is definitely Digital Twin.

How Digital Twins Enhance Large Event Spaces

Managing large event spaces, such as football stadiums and performance halls, comes with several challenges: ensuring security, responding to dynamic circumstances, controlling the influx of people, and providing the audience with a comfortable and entertaining experience.

check full video: https://www.youtube.com/watch?v=kqgYlSHVr0k

Hightopo 3D Visualization solution is the best fit for these circumstances. By capturing data in and around the stadium, allowing us to create a virtual copy(Digital Twin) of the area that will be used to provide analytics and insight into the experience of attending a game there. This data will help stadium and venues facilities managers to identify potential problems, optimize sustainability and manage risk.

Web-based Lightweight 3D Model

Utilizing Hightopo powerful 3d graphic rendering engine to achieve this interactive 3D scene. The web-based visualization solution enables interactive events from any modern browser. The elements/ scenes can be zoomed, panned, and rotated. The lightweight models make sure a fast and immersive user experience.

Crowed / Traffic Monitoring

Hightopo visualization solution combines 3D model with 2D data visualization such as bar chart, line chart and data indicator to display the important data sourcing such as traffic, crowd density, regional congestion etc. Breaking down the data silos.

Combine with facial recognition and 5G technology, the visualization solution will leverage stadium security and management. With AI technology, the system can even predict the traffic and crowd density, so that venues managers can act before things go sideways and to effectively guide and evacuate the passenger that exceeds the carrying capacity of the stadium.

3D Heatmap Visualizations

Through the image recognition and analysis of multiple cameras, a complete heat map(thermal map) of the stadium can be formed. The heatmap provides an understanding of crowd density distribution, help in decisions such as the number of employees needed and managing assets such as lighting and cooling devices.

Immersive AR and VR Experiences

The use of augmented reality (AR) and virtual reality (VR) is on the rise in large event venues, especially with the roll-out of 5G in event stadiums. AR and VR tools can help make the experience unforgettable, converting a one-time event attendee into a lifelong customer.

VR can provide a virtual tour of the entire venue to an immersive experience of the event. On the other hand, AR maps, which introduce geospatial awareness tapping into the users’ location coordinates, can be effective in guiding visitors to their seats, parking locations, and other spots within the event area.

Hightopo 3D models work seamlessly on VR and AR, the ht-vr.js plugin makes sure a smooth integration for your 3d scene to VR scene.

Surveillance Video Integration and Video Fusion

The digitization of information flow, coding compression, and open protocol enables a seamless connection between the intelligent network video surveillance system and the various subsystems in the security system, and realize management and control on Hightopo visual management platform.

Combined with video fusion technology, multiple surveillance videos can be fused, so that the originally fragmented video can be viewed in a panoramic view of the real three-dimensional scene, and the overall scene can be grasped from any angle required to help users quickly overview the overall situation. The 3d scene and the dome camera work together to accurately locate the target area to be tracked in the scene, and drive the pan-tilt to control and adjust the camera direction and focal length to achieve precise tracking.

Better Resource Efficiency

Minimizing operational costs and maximizing resource efficiencies are important objectives for building management. Digital twins — integrated with IoT sensors — enable data-driven decision-making, as they collect real-time data. Here are a few examples:

  • Gathering data from sensors, digital twins improve energy efficiency by automatically turning systems on or off, or adjusting settings, based on need and finding the right level of resource usage at specific times to serve large crowds.
  • Visibility into available parking stalls improves space management and also helps visitors not waste time and fuel finding an open spot.
  • Better facility management practices can be implemented with multi-scenario testing and predictive asset maintenance.

Meticulous Planning for Emergencies

A huge concern in large event spaces is to ensure safety and be prepared for possible disasters. A digital twin event venue helps with disaster response. It can model entry and exit points, a large number of people who will exacerbate an emergency situation, and numerous other constraints and stress factors.

AR and VR technologies take disaster response training from classrooms to the ground, aiding in scenario testing, simulating disaster events, and guiding through possible solutions. During an emergency, heat map visualizations help monitor the shifting footfalls and come up with a corresponding evacuation plan.

While conventional approaches rely on experience, expertise, and intuition in planning events in large spaces and stadiums, the advanced digital twin technology relies on sensors, AR and VR tools, heat map visualizations, IPS to gather real-time data and perform simulations that can assist before and during the event.

Conclusion

Hightopo visualization solution converts all quantifiable aspects of a physical building into an evolving virtual replica, allowing owners, facility managers and built environment professionals real-time insights to strategize and optimize every aspect of a building’s operations.

  • Insight into a building’s efficiency performance in real-time.
  • Predicting potential failures in systems like HVAC, water and electrical.
  • Providing project team with access to lookalike built and lookalike design models, which are constantly synced in real-time.
  • Providing insight to a client to support ongoing structural enhancements.

Besides stadiums, Hightopo has had also done some projects that cover archives, exhibition halls and other smart buildings. Combined with GIS, BIM and other technologies to improve the efficiency of operation and maintenance personnel and the green and intelligent development of venues and exhibition halls.

Concentrated Solar Power (CSP) generate electric power by using mirrors (heliostat) to concentrate a large area of sunlight onto a receiver and make it possible to achieve heat higher enough to turn water into steam. The pressure from water vapour drives a turbine connected to a generator producing electricity.

The solar thermal farm is usually large scale and in a remote area. It’s not easy in terms of maintenance and management. Fortunately, Hightopo lightweight web visualization solution — HT for Web can help. Get real-time monitoring operation status of each heliostat, sync data such as electric load conditions, equipment status and control, weather simulation, to reduce the operation cost and hazards of the outdoor operation, maintenance, management and control.

Lightweight Modelling

On-site photos, satellite images, bim files, designers will utilize them as reference and model each equipment lightweight, then import to 3d scene. HT powerful 3d rendering engine makes sure the massive models will still render faster and smooth on the web.

Weather Simulation

Sunlight is an indispensable fact of CSP management. HT visualization solution allows sync data from weather system, to simulate the sunlight in 3d scene and view the dynamic change of the sunlight in real-time or historical time periods. Data will trigger the corresponding weather animation, for immersive and vivid visualization.

Equipment Monitory and Management

HT for Web offers various kinds of interactive methods. The most fabulous part is HT for Web cross-platform capability, which means the mouse click, mobile touch, VR hit will all handle by one code function.

Integrated with heliostat, power tower and other equipment systems, data will be sync with 3d models and therefore trigger animation or data panels. For example, click the power tower on 3d scene to trigger the data panel which display the real-time data source from sensors from the power tower such as temperature, pressure, etc; When data exceed the threshold, the device will have an alarm animation such as dying in red and blink. This will greatly help operators to locate the issued equipment and act fast to avoid unnecessary downtime.

CSP v.s. PV — Integration for increasing Solar Power Penetration

Concentrated Solar Thermal systems (CSP), are not the same as Photovoltaic panels; CSP systems concentrate radiation of the sun to heat a liquid substance which is then used to drive a heat engine and drive an electric generator. This indirect method generates alternating current (AC) which can be easily distributed on the power network.

Photovoltaic (PV) solar panels differ from solar thermal systems in that they do not use the sun’s heat to generate power. Instead, they use sunlight through the ‘photovoltaic effect’ to generate direct electric current (DC) in a direct electricity production process. The DC is then converted to AC, usually with the use of inverters, in order to be distributed on the power network.

We also have an article which more in deep introduces PV farm visualization.

Conclusion

Hightopo offers the cutting-edge DigitalTwin visualization solution — HT for Web, empowers concentrated solar power plant and photovoltaics plant for better management. Helping deliver millions in efficiency savings and a massive reduction of carbon dioxide.

HT for Web brings great value enhancement to the power, energy and other industries. The lightweight, cross-platform, responsive, fully interactive feature help clients enter the path of the energy revolution and digital transformation.

Based on years of project experience and solid visual tech, we have cooperated with many well-known industries. Contact us to explore more possibilities!

Digital transformation is becoming a standard rather than an exception by now. Smart City management is now required more and more multi-dimension data fusion, data analytics and data mining. Especially required to leverage location-based analytics to connect people with information and technology, and help them improve their quality of life and make better choices.

Hightopo visualization solution integrated with related GIS (Geographic Information System) technology to drive further development, brings all aspects together and enables the consistent use of digital models and data to open numerous new opportunities, offer new service and efficient operation benefit the smart city ecosystem. Empowering businesses to gain a competitive advantage with location intelligence.

Smart City Lightweight 3D Modeling

• Drone Photography Modeling

Oblique aerial photograph is taken with the axis of the camera held at an angle between the horizontal plane of the ground and the vertical plane perpendicular to the ground. It’s a GIS technology that has developed rapidly in recent years. The aircraft or drone is equipped with multiple sensors to capture the ground objects from the front, back, left, right, and vertical five directions to quickly and efficiently obtain data information that truly reflects the ground conditions. Through a series of professional processing operations such as correction, adjustment, and multi-view image matching, to create a 3D model.

• BIM

*BIM *(Building Information Modeling) is the holistic process of creating and managing information for a built asset. However, since BIM file contains massive data and it’s usually too heavy on the web, Hightopo offers a BIM convert solution that allows users to select part of data so that the model will be lightweight and have smooth operation efficiency.

• Manual Modeling

It must be clarified that since models are the mapping and restoration of the real world, it depends on various data sources, including point cloud data, tilt photography, satellite images, panoramic images, aerial video, etc. However, these real data are more or less problematic, so a secondary design is needed to achieve accurate geographic location, matching regional style, and smooth operation efficiency.

For those buildings that required a high level of detail, manual modelling comes in handy. Designers will utilize CAD, aerial photography, satellite images, on-site images, etc as references to model the building or the inside equipment/devices. Then input to HT, to achieve an interactive Web 3D scene, which can be zoomed, translated, and rotated. Each device in the scene can respond to interactive events.

Weather Simulation

HT powerful graphic rendering engine enables dynamic weather simulation on the web. By integrating with the weather system, the interactive scene will simulate different weather scenarios. Also display the temperature, air quality, and related information.

3D Walk-through & Fly-through

HT integrated GIS and remains the walk-through and fly-through functionality, allows users to patrol and roam the area from a first-person perspective according to a pre-set route.

Industrial Park Management

Hightopo offers a one-stop comprehensive visualization solution from industrial park construction, underground pipeline management, attracting investment to traffic management. Empower operators and managers to track each phase and be prepared for what is next.

•Underground Pipeline Construction

In terms of land use planning, they are distinguished by different colour blocks. Through analysis of land use distribution, land use requirements, functional positioning, etc., to reasonably determine the development intensity, land use scale and control requirements of the plots.

The underground pipeline system not only solves the problem of urban traffic congestion but also greatly facilitates the maintenance and overhaul of municipal facilities such as water, electricity, gas, heat, and communications. Hightopo uses lightweight modelling technology to simulate the underground pipelines, and utilize 3D visualization, it greatly improves the quality of the operation and maintenance service of the integrated pipeline gallery, and accelerates the construction of a 3D green pipe gallery with intelligent control and intelligent operation and maintenance.

•Investment Attraction

Investment attraction is an important work after the completion of the smart park. The investment in the park is mainly about the leasing and rent of the buildings in the park; the placement of advertising spaces in the park; the distribution and usage of park parking lots and the distribution of POI (Point of Interest) data of the park service facilities, etc. The overall investment promotion situation is fully presented, attracting more enterprises to enter the park. Smart investment in the park allows the industrial park operators and managers to save a lot of time and labour costs, and improve the efficiency of investment.

•Traffic Management & Video Fusion in 3D Environment

The visualization of traffic supervision creates a “Skynet” in the park through a series of connections and integrations of traffic monitory and supervision system, which allows a comprehensive control and management of current traffic.

Video Fusion or virtual and real fusion technology is one of the key links in video enhancement of 3D geographical scenes. The video images are accurately fused and displayed in the real and precise geographic coordinates of the space corresponding to the 3D model. This fusion will not cause dislocation due to interaction such as dragging and rotating the 3D model.

HIghtopo video fusion technology uses WebGL technology and uses GPU high-performance computing capabilities to process video images in real-time. Image processing does not occupy CPU resources, to make sure of a smooth loading.

Building Management

Hightopo offers an enhanced solution to traditional BA building management need. The system connects to and synchronizes with building devices through IoT technologies, facilitating an integrated operating system for device maintenance, lighting, ventilation, security, fire control, and elevator, all presented with 3d visualization to maximize efficiency.

•Elevator System

The sci-fi wireframe style design enables an intuitive visual of elevators real-time operation status. The data source from the elevators system will trigger the animation and display key data on side pannels.

•Lighting System

Integrate the lighting system inside and outside the building, use the HT Smart City visualization platform to centrally monitor the lighting equipment in the building, adjust the lighting effect mode at different times, analyze the environmental illuminance and lighting energy consumption through the data trend graph. The running status of lighting detection is updated in real-time so that managers can deal with lighting system problems in time, problems can be discovered and dealt with in a timely manner, and improving the management efficiency and service level of the building.

•Fire System

The fire equipment location is indicated with the red light point in the scene. The operation and monitoring status of each fire equipment; the number of smoke and electrical fires; the number of fire alarms; the real-time update dynamics of the firewater pressure, and the abnormal situation all can be checked and displayed on the data panel.

When a disaster occurs, the visualization system can quickly know where the problem is, so that firefighters can execute the corresponding plan, complete the planning of the optimal escape route, call the alarm system and broadcast to remind the people in the building to escape from danger, and ensure the safety of lives and properties inside the building.

•AC & Ventilation System

Visualize and monitor the environment status such as outdoor PM value, temperature and humidity, wind speed, and indoor real-time temperature, humidity, carbon dioxide level and other information. Also, in this project, we integrated the cooling monitor system. Display the vital data such as operating power, unit operating status, working conditions, and VRV(Variable Refrigerant Volume) system operating status of the water-cooled host.

Conclusion

In the era of rapid economic development, industrial parks (software parks, technology parks, logistics parks, etc.) are the important part of smart city development. Digital transformation is now the crucial need for industrial parks to upgrading towards to a smarter, greener city component.

Hightopo self-developed a powerful 2D and 3D visualization engine, and it can be seamlessly integrated with GISBIM, and video fusion technologies, and accesses oblique photographyGIS spatial information data, Internet of Things IoT data and big data system platform and other data information. Combined with lightweight modelling solutions to archive the B/S structure of comprehensive visualization and management tool. The cross-platform ability allows users to access the system from any device at any time!