hightopo

You may be hearing the term “digital twin” quite a bit recently, as a concept first introduced back to 2002, digital twins now already have much wider usage thanks to the Internet of Things (IoT) has started to become more and more normal. (In case you are not familiar with ‘digital twins’, here is our article regarding the intro of Digital Twin)

Today, let’s focus on a digital twin solution for the wind power industry — simulation of wind turbines.

For the wind industry, a digital twin’s value lies in using the data to understand the health condition of a wind turbine or a full fleet. The data provides valuable insight into when turbine maintenance is anticipated so operators can plan operations and maintenance well in advance.

Now let’s think about wind turbines. What kind of “behaviour” do they have and how to monitor it? Generally speaking, wind turbines’ behaviours are very hard to predict, due to the highly variable and quickly changing nature of the wind itself. The good news is that today we can improve it by using Digital Twins.

The Digital Twin receives data from the wind turbine’s sensors and simulates the behaviour in real time, offering insights into current health status, future failures and also detects underperformance. The wind farm operator will be notified in advance about any occurring problems.

As the dashboard view shown above, we analyse the data and put data in various formats for a better monitoring. On the top left, we put environment data such as weather, wind speed, component information, temperature to a barchart. And the barchart changes smoothly based on the real time data. Through the constant collection of this data, our digital twin model now turns data into actionable insights.

Click the picture to check full video

On the left bottom, the system showcases the turbines status based on real-time data sent back from sensors. Highlight the errors and also trigger the alert animation so that wind farm operators can visualize and analyze the assets. The result allows for advanced wind performance and predictive maintenance capabilities.

With the help of our solution, we can help increase revenue, reduce costs, and lower risk. Digital Twins of wind turbines allow us reducing maintenance costs by:

· Reducing the number of visits to the wind farm;

· Fixing broken parts instead of buying new ones;

· Providing a root cause analysis on component level (when, how, where and why it will fail).

By creating Digital Twins on wind farms, the performance of clean energy assets will enhance, making renewables more affordable and help the world in moving towards a Greener Economy.

If you are interested in more digital twin solutions, please visit Hightopo website for some inspirations.

What is a Containerized Data Center?

A containerized data center is a shipping container that is set up to accommodate IT equipment. The container may be configured to accommodate some combination of servers, storage devices, networking gear, uninterruptible power supplies, generators and cooling equipment.

There are many advantages to using containerized data centers for all or part of your data center needs: free up space, designed to be energy efficient, rapid deployment.

In the meantime, there are some possible deployment challenges that may occur. For instance, a thorough understanding of what you get, finding the right location, also the appropriate power, cooling, and IT infrastructure.

Hightopo 3D visualization solution

For this reason, Hightopo brought up a 3D visualization solution to completely simulate the overall picture of the data center, and further archive the goal of centralized deployment and management of many subsystems.

Data visualization

On the right-hand of the dashboard, you can check the overview of the containerized data center, such as capacity statistics, asset statistics, pipeline statistics, alarm statistics, etc. An overall view of the containerized data center structural layout, as well as equipment information such as cabinets, servers, air conditioners, generators, power distribution cabinets, and UPS, etc.

Individual Cabinet Visualization

Each cabinet is clickable and we can visualize/monitoring each cabinet’s information remotely. The real-time data and historical data allows operators to be more proactive as he can get a view of what’s coming and be more prepared on what to do about it.

Pipeline Visualization

Pipeline indicated power flow, this can effectively sort out the electrical pipeline and network lines, allowing operators to be more intuitively understand the big structure of the pipeline and quickly troubleshoot issues to reduce downtime.

Temperature & Humidity Visualization

It’s essential to maintain and control ideal environmental conditions, with precise humidity and temperature measurement to increase energy efficiency whilst reducing energy costs in Data Centers. Hightopo provides a fully 3D thermal map that indicates the temperature and humidity intuitively. Once the environment changed to a certain level, it will alert the operators and allows operations to quickly located the overheated machine.

Hightopo is a company specialized in 2d & 3d visualization, we developed a powerful web-based 2D and 3D rendering engine which provides rich display effects for data visualization.

Click the picture to check full video

tunnel boring machine (TBM), also known as a “mole”, is a machine used to excavate tunnels with a circular cross-section through a variety of soil and rock strata.

How It Works

The first part of the TBM work is the tunneling phase. The TBM has a cutting wheel which is pressed against the tunnel face by hydraulic cylinders. Inside the cutting wheel, the disc cutters and scraping tool loosen the material.

If the earth is unstable and to stop the tunnel face collapsing or digging too fast, the TBM uses the soil that has already been dug out by the cutting wheel to support the tunnel face. This creates a stable environment for the tunneling to move forward.

The tunneling face is continuously monitored by pressure sensors. They check the turning power of the cutting wheel and the screw conveyor and they also keep track of the material that has been excavated.

The material is then taken away on conveyor belts.

Once the tunneling phase is done the cutting face and the screw conveyor are stopped and the ring building phase starts.

A complete tunnel ring consists of several linning segments made of pre-build reinforced concrete. They must match the exact size required and are taken into the tunnel on flatbed rail.

The concrete segments are fed by the concrete feeder and lifted into place using a vacuum. The hydraulic cylinders are temporarily retracted in order to provide enough space for the new segment. The segments are positioned with millimeter precision and held in place by cylinders before being finally bolted into position. The conical keystone is put in from the front to complete the lining ring.

During all this work, people and the machines are protected by the shield skin from the saturated ground, where water is under pressure.

All the readings are displayed and fed back to the machine operator.

Combined with real-time monitoring of HT's data visualization panel, various data indicators of the construction process are displayed in real-time. Intelligent analysis and collection of back-end data truly reflect the real-time dynamics of each module, allowing managers to understand the situation of each section and perform quick maintenance and management.

Why Hightopo Visualization?

Traditional construction often uses BIM models, but the BIM modeling often too large in terms of data size and the model itself is not beautiful enough.

Our visualization solution not only improves the work efficiency of the construction site but also monitors the progress of the project in real-time.

In this case study, we compared the traditional modeling and Hightopo’s light-weight visualization solution. Hightopo’s web-based 3D visualization has a more flexible and vivid effect. And this will enable customers to understand quickly how the product work and the product advantage so that to gain an actionable insight.

The light-weight web-based solution requires no plugins or downloads, it just works seamlessly on any modern browser & device.

How We Can Help You

Hightopo specializes in physical simulation, industrial simulation, data visualization. Providing clients the one-stop data visualization solution from consulting, design, development to post-sales support.

We are a dedicated team devoted to web-based 2d & 3d computer graphics technology, with more than 10 years of proven industry experience, we are committed to bringing our visualization solution to the world.

Check our website for more industry visualization inspiration and explore new possibilities with us!

*District heating (also known as heat networks or teleheating) is a system for distributing heat generated in a centralized location through a system of insulated pipes for residential and commercial heating requirements such as space heating and water heating.*

*Click the picture to check full video*

The most popular heating system is individual gas boiler. However this is not the most efficient method. District heating is the concept of one large central boiler instead of many individual boilers. And this is usually so-called energy center. There are many heat source for the energy center such as gas combined heat and power energy from waste or renewable energy sources like heat pumps biomass and anaerobic digestion.

Hightopo visualization solution simulates the whole city layout and utilizes the 3d model and 3d animation to indicate the pipeline. The hot water travels through an underground insulated pipe network to heat interface units located in each building.

How it works

The heat is often obtained from a cogeneration plant burning fossil fuels or biomass. District heating replaces individual boilers, it uses less energy, costs less, is environment-friendlier and makes cities more pleasant places.

Inside the cogeneration plant, there usually be a control room, in here heat production and distribution are monitored and controlled around the clock. With the real-time data, hightopo empower the plant operators to get an actionable insight.

The heat travels, as hot water or steam, through an underground pipe system. This is the primary circuit. then it reaches substations in apartment buildings, office blocks, public buildings and sometimes industrial districts or shopping centers. Substations are dotted around the network.

The heat pump suppliers energy for district heating and cooling by capturing waste heat from treated wastewater. The district heating water running in the distribution network reaches the customers at 70–115 degrees and returns to be heated once it has cooled down. The hot water reserve is used to balance out peak demand for example in the mornings. this eliminates the need to startup oil-powered heating substations for moments where it needs.

Each substation has a heat exchanger that transfers the heat from the primary circuit to the secondary circuits in buildings. Inside, they split into heating circuits and hot water circuits. The heat then warms up the building, through underfloor systems and radiators for instance, and other appliances.

The network is continuously being extended and serviced. The old sections of the network are repaired following a maintenance plan. We highlighted the area that one heat exchanger can cover. So that once one place is down we have an intuitive view of which exchanger should go for maintenance and service.

Why Hightopo Visualization Solution

Hightopo developed a powerful web-based 2D and 3D rendering engine which provides rich display effects for data visualization. With this, we provide our client a light-weight, cross-platform, responsive, fully-interactive digital twin solution. Empower our clients to turn real-time data into insights for better, faster decision-making. As the nature of web-based feature, there’s no need for plugins or downloads, it just works seamlessly on any modern browser & device.

smart heating system deep integrated network, information, and intelligent digital technology and heating facilities. Aiming for energy saving, consumption reduction, and cost effective, tailored made for heating companies.

It achieves monitoring of the entire heating system from the pipe network to the indiviual end-user; improves process & operation management efficieny; enable remote monitoring and unattended operation. Monitoring facilities status and exponentially increasing efficiencies over time, unlocking additional value from existing assets, dramatically lowering maintenance and operating costs using physics and analytics to eliminate unplanned downtime.

With the lowest cost and highest efficiency, Hightopo meets clients needs for greatest extent, promotes the efficiency and conservation of energy use, and achieves the goal of heating energy saving to the greatest extent.

As a common fuel, natural gas is closely related to our lives, and for the storage and transmission of this fuel, there are strict requirements for natural gas supply stations. Gas companies generally design supply stations as unattended stations, however, the safety management of supply stations is often particularly important in the process of operation and management. When an accident occurs, the early warning and response plans become an indispensable part.

Hightopo comes up with an extraordinary simulation solution for natural gas power plants, utilizing the innovative 2D/3D visualization modeling technology, digital twin 3D visualization system, to provide a set of solutions integrating display, monitoring, early warning, and pre-planning. Enabling the gas industry towards the direction of informatization, visualization, and environmental sustainability.

Modeling natural gas plants in a realistic style, the web-based feature makes our digital twin solution accessible in all modern devices, PC, Mobile, Touch Screen, etc.

The robot will travel along a special route and auto inspect each device, display detailed information or alert message.

Visualizing site layout, structure, operation status. When a facility or equipment breaks down, it will change to a red warning style, which visually reminds the operation staff to take corresponding measures.

Connect to the surveillance video source, it supports viewing real-time footage of the factory area and provides timely and effective information for operation and management.

It’s very dangerous for a natural gas power plant with a large storage capacity, therefore, it requires a comprehensive fire control system. Simulating on-site firefighting rescue plan with 3D scene & animation provides reliable and effective information for operation & management staff.

Lightweight modeling, yet BIM supported

Traditional modeling file — BIM, offers a digital representation of the real facility, including function systems (HVAC, electrical) and aesthetics (walls, roof, windows). Generally speaking, BIM files are very heavy in size, from a hundred MB to a few GB. This is almost impossible for the Web where all display content is loaded in real-time.

Hightopo's visualization uses lightweight modeling to build scene effects. The model effects are mainly presented with textures to ensure efficient loading and smooth operation on web pages. We also support import IFC format BIM files and optimize the file to reduce the size and create a 1:1 high detailed modeling visualization scene.

As data center complexity continues to increase, Data Center Infrastructure Management (DCIM) solutions must become essential tools in the IT stack. With the right tool, you can reduce costs, increase productivity, optimize your physical space, and improve system integration.

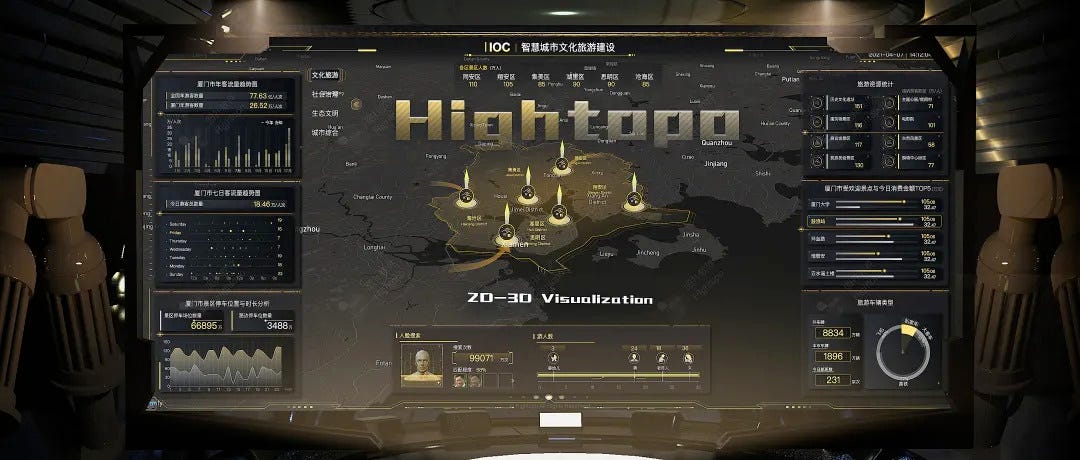
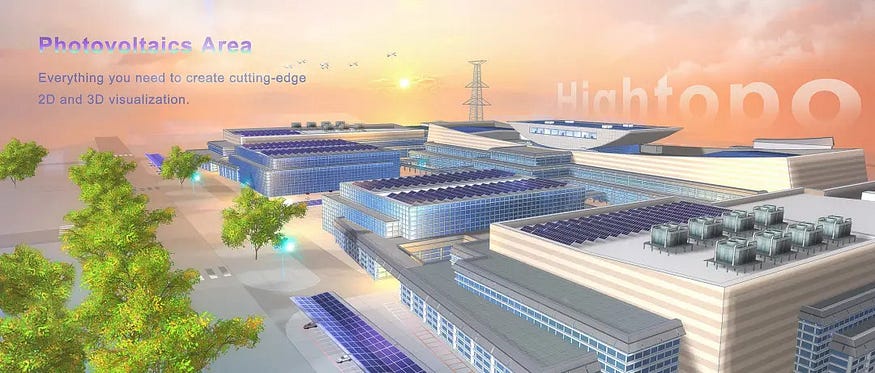
In this article, we introduce Hightopo 3D visualization tool to build a comprehensive 3D data center management system that brings together various IT and facilities systems, including generators and servers, to perform power usage effectiveness reporting, data center visualization, dashboard reporting, and, ultimately, control to improve the data center’s performance and efficiency.
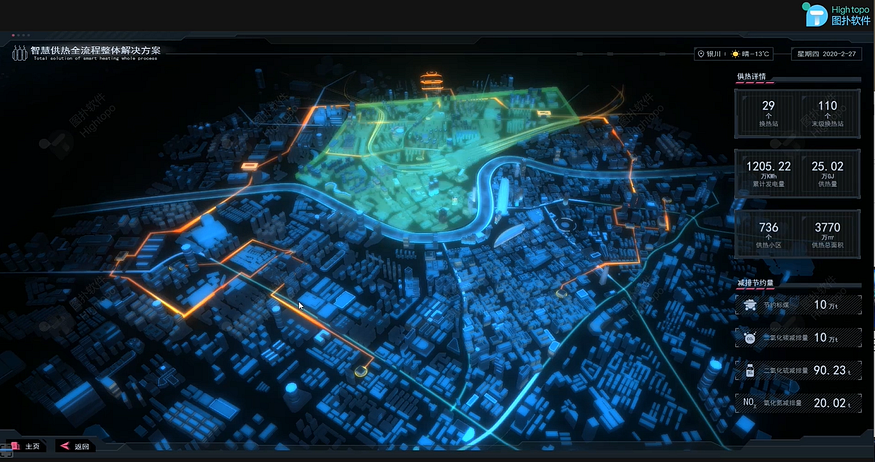
From macro to micro

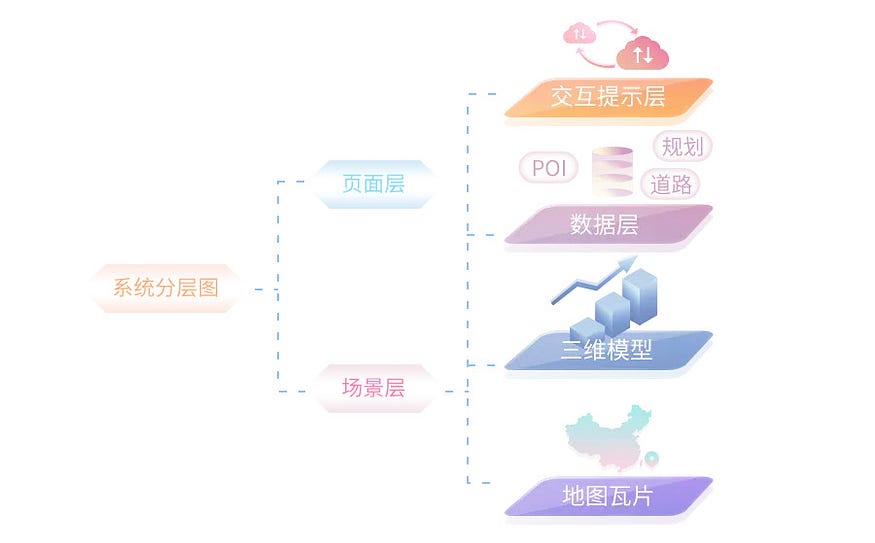
Utilizing 3D virtual simulation to show eath panorama. This can be easily archived by the HT (ht-for-web, hightopo 3d visualization SDK) build-in spherical mesh applying earth surface texture. And by accessing the latitude and longitude information of each data center location, the position of the coordinate point can be automatically generated, so that we can see each location in all parts of the world more intuitively.

Even though HT supports GIS by integrated the opensource Cesuim solution(check the FAQs session at the end of this article), it’s unnecessary to use WebGIS related functional modules in this certain scenario, as to using simple trigonometric functions to perform spherical coordinate algorithm calculations to achieve the desired effect. In contrast, this simple solution will be much lighter and faster, and it does not even require the intervention of modeling, which will greatly reduce the implementation cost and cycle.

Although it can’t dynamically load the map details through LOD(Level of Details), the scene interaction design can also display various visual effects more freely. For example, in this demo, we switching scenes from the earth to region, to building, to the data center, then to the cabinet by clicking highlight elements.

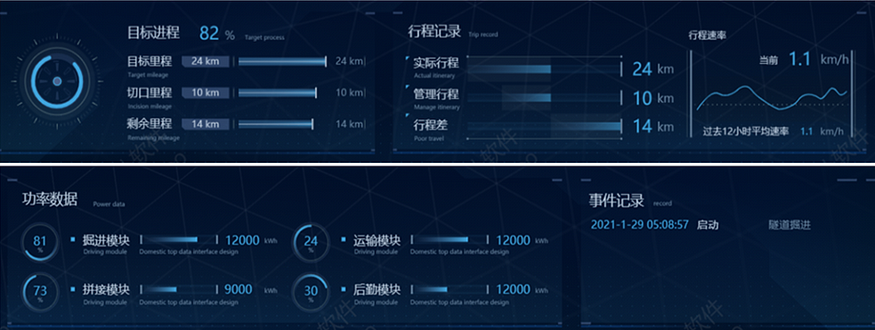
Dashboard Reporting/ PUE reporting

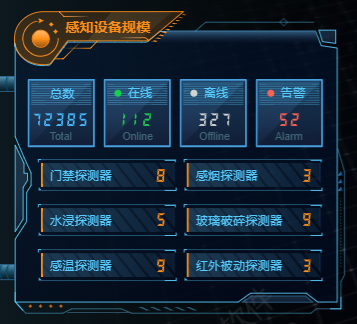
DCIM visualization solution integrated data center information such as numbers of cabinets, area of the data center, numbers of AC, PUE(Power Usage Effectiveness), CADE (Corporate Average Datacenter Efficiency), energy consumption rate etc, and display the data on the dashboard on real-time, average, and peak power use. This helps decision-makers to observe various objects to the greatest extent and get an actionable insight faster, better.

Also, as a monitoring system, early-warming and alert is a must. Set up the EDI direct connection between data center sensors and our visualization dashboard, all the alert information will be display on the dashboard in real-time. Setting the threshold, when the data value triggers the alert, decision-makers will get a notification immediately.

IT Assets Management & Visualization

Assets visualization module follows the level of interactive, display each asset status. Integrated lifecycle management functionality, maintain an accurate inventory of data center assets and real-time views across your entire data center, including equipment in racks like servers, storage, networking equipment, rack PDUs, patch panels and even applications. Get the latest and detailed information on assets, for instance, make, model, serial number, name, rack location, RU position, configuration, data ports, connectors, protocols, data rates, power connectors, voltage, watts, amps, purchase price, purchase date, installation date, warranty period, maintenance dates, asset status and more.

Furthermore, Fuzzy Search /Approximate String Matching is supported, quickly locating desire assets and get detailed info.

Capacity Management & Optimization

One of the most important things you need to keep tabs on in your data center is whether it’s reaching capacity. Essentially, visualizing manage network and device resources, power load, cooling capacity, and storage in various charts or tables to get a better insight.

It helps managers decide where to put additional servers and other IT equipment in terms of optimum operational efficiency from a power and cooling perspective. Also, it helps reduce downtime by analyzing the data center infrastructure and using simulations to highlight areas suffering from a lack of redundancy or capacity constraints.

Ultimately, combine with a surveillance system, allows the integration of PDU(Power Distribution Unit) monitoring. Empower DevOps to check capacity and energy consumption based on different areas. For instance, check and statistics based on each floor, each room, each cabinet for an institutive insight.

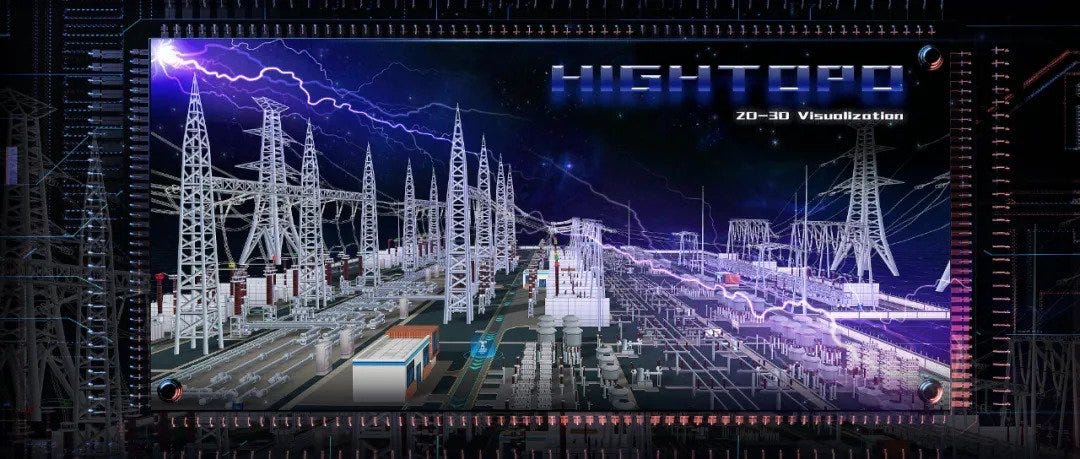
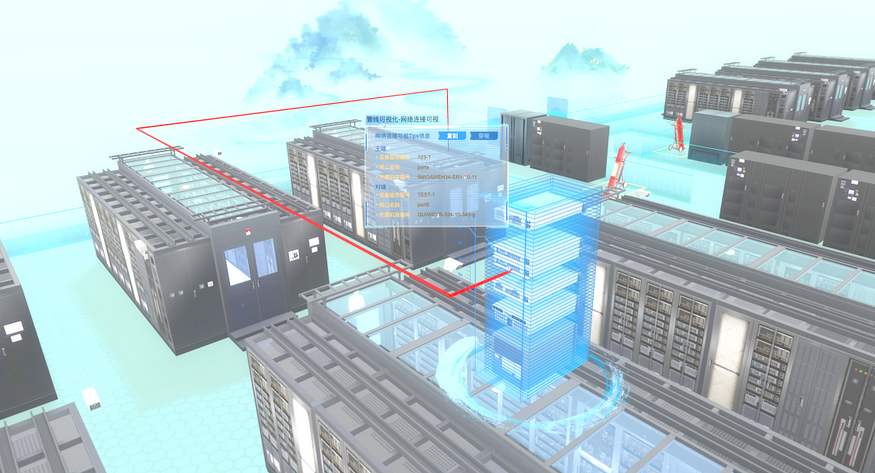
Pipeline Lightweight Visualization

Pipeline visualization usually focuses on network links, HVAC pipelines, electrical wiring. However, most of the pipeline is underneath the ground or hiding inside the wall, which makes it hard to do traditional 3D modeling. On the other hand, in the operation aspect, there is no need for a real position of the pipeline, we are more interested in the monitoring and alert.

Therefore, Hightopo brings a special pipeline visualization algorithm to generate pipelines that link from one equipment to another. Integrate with real data sourced from the control system, visualize and monitor network interface, HVAC pipelines (water-cooled air conditioners, water towers, chillers, cooling pumps, constant humidity machines), electrical pipelines (transformers, distribution boxes, battery packs, battery cabinets, switch cabinet, control cabinet) and other pipelines.

Environmental Monitoring

In a data center, there are many pieces of hardware and equipment that make up the moving parts necessary to protect critical information. It’s crucial to ensure that a colocation facility is committed to keeping track of all environmental variables for each piece of equipment. This helps the facility’s technical team remain aware of issues requiring corrective action, and enables them to enact the preventative measures necessary to avoid these issues in the future. Proper utilization of these environmental monitoring tools will allow the data center provider to see which system is using which resources, in turn positioning the facility for optimal use.

  • Power & Voltage Monitor types of equipment info such as the input and output voltage, electric current, power, battery voltage, status of rectifier, inverter, battery and other components. Record and alarm when the abnormal status occurs.
  • Temperature & Humidity Connecting to the data center IOT device( temperature & humidity sensors) to get the point-to-point data and display them in 3d heatmap. Many data centers these days installed sensors along with high, medium, low vertically. Utilizing the 3D thermal cloud map brings a more intuitive visual experience and quickly locates the heating conditions of the equipment on each cabinet.

  • Airflow Proper airflow within the data center is closely tied to the facility’s air conditioning system. Maintaining airflow will work in conjunction with temperature and humidity control, acting as a third regulator for consistency. According to the data transmitted by the temperature and humidity sensor, a real-time airflow map — CFD (Computational Fluid Dynamics) is formed, so that the flow direction and distribution of cold and hot airflow in the computer room can be clearly seen.

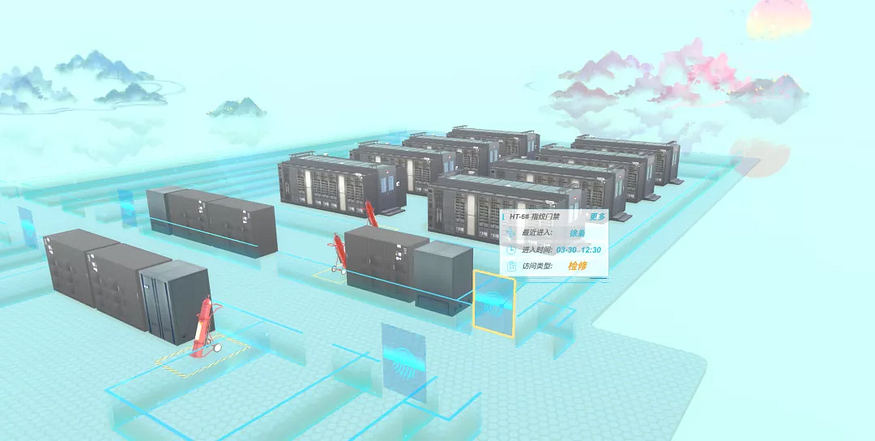
  • Security Management (Smoke & Fire Suppression, Access Control) Smoke and fire alarms are wired into the alert system so that in the event of a fire, the alarm will alert the technical team in order to tend to the facility’s critical equipment as soon as possible. Access Control is another crucial part of security management. Integrated with video surveillance and access control system, allows visualizing all the surveillance cameras and access control location, view the real-time camera footage, get historical information about staff enter and exit. HT visualization tool extends from vanilla HTML5, which can only support MP4, OGG format of video. However, steaming RTSP can be achieved by converting RTSP to HLS. Furthermore, the access control system supports facial recognition and records the unauthorized person. Emerging video fusion technology (using texture + algorithm to process irregular shapes, video correction, color correction) to achieve the effect of virtual and real scene combine together.

  • Energy Consumption Monitoring Adopt a visual energy-saving strategy, use the intelligent algorithm provided by the Hightopo, calculate the current equipment and environment temperature, and automatically recommend power for each cooling equipment. Optimize the airflow of air conditioning in the data center to reducing energy consumption and to effectively cooling.

  • Early Warning A comprehensive warning and alarm system is integrated. Including event self-diagnosis, analysis, and other functions. For events that exceed the performance threshold, it will show the warning information and notify the DevOps team. Saving historical information and alarm events also supported .

Conclusion

Hightopo DCIM tool ties together data from the IT side — virtual machine, server, storage or network equipment — and data from the facilities side — cooling, power distribution unit, uninterruptible power supply, sensors, or generators into an overarching monitoring and analytics environment that lets them make better decisions, optimize the use of their capital spending and increase the overall efficiency-related not only to power but also to capacity, utilization, and operational aspects.

Furthermore, Hightopo DCIM tool is also a good fit for edge data centers, which likely have few or no IT staff on-site. No software is required at edge sites, and they can be monitored remotely — from any device that supports a web browser.

FAQs

How to make a 3d model like this?

We recommend clients provide satellite images, design sketches, aerial views of the property, CAD drawings, on-site photos, etc to designers for modeling.

I already have BIM(Building Information Modelling), can we use that for web display?

BIM, offers a digital representation of the real facility, not only the basic shape of the building but also including function systems (HVAC, electrical) and aesthetics (walls, roof, windows). Therefore, BIM files are very heavy in size, from a hundred MB to a few GB. This is almost impossible for the web where all display content is loaded in real-time.

Although HT encapsulates ht-bim.js to read the IFC format BIM file and dynamically load part of the model and then rendering on the web in real-time for a faster display, in real-world projects, we still need to consider various facts to analyze whether to use bim or not. For instance, visualize underneath pipeline which is impossible to re-modeling and has to use the bim. But for most cases, we do not suggest use bim as it’s mainly for construction purposes and does not look appealing. Re-modeling the property and minimum file size by using texture to present details ensures efficient loading and smooth operation on web pages.

An Integrated Command and Control Centre (ICCC), as the name suggests, works as a brain for all smart solutions implemented across a city — be it a surveillance system, smart traffic management, waste management, utility management, environmental sensors, public information system, etc.

Responsible development requires robust spatial information that is refined and constantly updated. In addition, foresight and problem-solving skills are required to put data to good use. This challenge has made Geographic Information System (GIS) invaluable to the city ecosystem to integrate every aspect of a city from conceptualization and planning to development and maintenance. Combine GIS with Cloud ComputingBig DataIoT, Data Visualization and other kinds of technologies, to help different stakeholders prepare for exigencies, coordinate and manage response efforts, and enhance the ongoing efficiency of city operations.

Hightopo’s HT for Web visualization platform integrated with GIS, supports loading geographic data from various kinds, such as 3D Tiles, Map Tiles, etc. Visualizing massive data such as POI(Point of Interest) Data, Traffic Data, Urban Infrastructure Data, etc.

The Smart City concept aims at developing a comprehensive system that uses geospatial data to enhance the understanding of complex urban systems and to improve the efficiency and security of these systems. This geospatial data concerns (i) the urban built environment such as infrastructure, buildings and public spaces, (ii) the natural environment such as biodiversity, green spaces, air quality, soil and water, and (iii) urban services such as transport, municipal waste, water, energy, health and education.

Environment Smart city planners can model potential buildings and predict short- and long-term impacts on the environment. Conservationists can choose where best to incorporate green spaces or plan conservation projects, as well as analyse air quality and spot its causes in different areas of the city.

Governance City agencies often use location technology to share data across silos and operate more efficiently. Smart city operation platform centralises the city’s open data and communicates with citizens about smart city initiatives.

Human Capital Strategists and business leaders can analyse the demographics of a city’s population and use that insight to plan improvements that attract specific talent.

Mobility and Transportation

GIS empowers the assets management and long-term plans improvements of the country’s traffic. Meanwhile, IoT-based applications can be used to optimise the flow of traffic in the city.

Combined GIS with building information modelling (BIM) technology, underground infrastructures can be undertaken by knowing the precise locations of them and, to safely weave new tunnels through the built environment.

Urban Planning City leaders, businesses, and architecture, engineering, and construction (AEC) firms can see how a structure will look before they decide to build it, measuring views from a virtual apartment window or the shadow of a skyscraper on a local park. And Digital Twin and location data is come to help. Utilizing 3D models of their physical infrastructure and location data as a connective thread to experiment with virtual plans.

The Business Value of Smart Cities

The HT for Web GIS is intended to helping users integrated location information (GIS related) into their own projects, and reduce users’ learning and investment costs for GIS. Combined with the powerful visualization engine, enable superimposed display of different map tile data, oblique photography, 3D model, POI and other data; Combined with HT for Web BIM, enable the combination of BIM model and GIS Visual display; Combined with HT for Web 3D video fusion, to achieve real-time video fusion display in GIS scenes. The HT for Web GIS makes the visual display of GIS data richer, clearer and more intuitive, empowers users with data-driven insight.

Conclusion

Hightopo HT for Web GIS provides local government with tools to develop smarter cities and deliver better services to the community. As a collaborative platform, it enables government agencies to share spatial data to break through traditional data silos and build a more transparent organisation. Furthermore, the platform can be scaled to provide the tools for enterprise-wide data-driven decision making that improves management efficiency. Its mobility capabilities allow staff to access data any time, on any device, from anywhere to ensure enterprise data is always accurate and up-to-date.

As the core component of the power grid, the emergence of smart substations has changed the traditional substation operation and maintenance mode. Utilizing the digital twin 3D model and visualize the data in real-time or historically, digital transformation is becoming a standard rather than an exception by now.

In the power sector alone, getting enough data is a small part of the problem: getting the right data and knowing what to do with it is the biggest challenge. The electrical network digital twin is the core enabler for the decarbonization and decentralization of power infrastructures. Digitalization drives further development, as the consistent use of digital models and data opens numerous new opportunities, such as new service offerings and efficient grid operation with networked assets.

In this article, we illustrate the digital twin visualization system for a 500kV electrical substation by the Hightopo 3D Visualization solution. Build 3D models lightweight, establish dynamic digital substation, and get a multi-dimensional presentation of substation operation and maintenance scenarios. Enable real-time monitoring of substation operation status, and interconnection of operation and maintenance equipment, control systems, and information systems. Strengthen the full-state perception and control of substation equipment, enhance the ability to guarantee safe production in substations, and improve the level of lean management of operation and inspection.

Integrated GIS for Spatial Information

There are thousands of substations across a province, it is obviously impractical to use manual placement to illustrate each substation location. By integrated with Geographic Information System(GIS) to display rich spatial data, algorithms will be used to convert latitude and longitude coordinates into plane coordinates to dynamically generate substations location. The advantage of using GIS is that you can load more map details in Levels of Detail (LOD), and you can directly and accurately get the specific location of each substation.

Lightweight 3D Models

Hightopo Visualization is a web-based solution, considering the loading speed on a web browser, we recommend models total faces under three million. The lightweight 3D modelling technology is used to restore the appearance of infrastructures based on a CAD map, aerial view, and three-view drawing of the equipment at the substation site, which can be zoomed, panned, and rotated, and each device in the scene can respond to interactive events.

Monitoring & Management

Visualize multi-sourced data on 2D pannel through interactive bar chart, line chart, tables, etc. Data collection from generators, substations, microgrids, and industrial and building loads can be combined with many other data sources to inform grid operators about the overall situation. This real-time data can be integrated into GIS along with weather and smart meter data. Breaking down the data silos.

When the devices monitoring sensor detects unusual actives, for instance, reach the threshold, the backstage pushes the status parameters to the forestage, and the forestage shows the corresponding device icon in the position according to the status parameters. Combine with artificial intelligence analysis and other technologies to analyze historical and real-time data for predictive & prescriptive maintenance and operation.

Visualization of Electricity Flow

Through 3D visualization technology, display all the loop directions of voltage transformer and current transformer power supply, combined with scientific and technological sense elements to simulate the current flow, archiving the monitoring, measurement, control and adjustment for primary equipment (transformers, circuit breakers, isolating switches, etc.)

Heatmap(Thermal Map) Visualization

Utilizing a 3d heatmap to illustrate real-time data source from the temperature and humidity sensor in the transformer. The real-time temperature data of the current position can be displayed when the mouse is hovering over the position, which can more quickly and accurately locate the specific transformer component for the unusual overheat, timely response measures should be taken to efficiently solve or avoid uncontrollable problems.

Real-time Monitoring of Perception Data

Each type of sensor distributes points according to the actual installation position, and identifies the online monitoring points of primary equipment one by one. The sensor status of each point has a corresponding display effect, e.g. warnings status marked in red, and abnormalities status in a red flashing. When the mouse is over the sensor point, the real-time status information panel will be displayed. When the sensor point is clicked, it will show its detailed list to view the historical data and trend curve of the sensor. At the same time, you can conveniently switch to query historical sensor data and trend curves in other locations according to the menu.

Robot Inspection

Daily maintenance of substations requires a large number of inspectors to inspect the equipment, which is not only inefficient but also very dangerous, and severe weather such as high temperature, heavy rain, and heavy fog frequently occurs, which brings many obstacles to manual inspections. The intelligent inspection system that cooperates with outdoor inspection robots replaces manual inspections for autonomous monitoring. Through the intelligent inspection system, the alarm information is issued according to the alarm equipment, and the target location can be reached at the first time, and the inspection video and alarm information can be viewed in real-time. The staff can know in time and make a corresponding response. The use of robot inspection not only improves work efficiency, reduces the labour intensity of operation and maintenance personnel, and reduces operation and maintenance costs, but also effectively improves the safety monitoring and management of unattended substations.

Workforce Safety — Personnel Positioning

Track the position of the staff in real-time, and mark the position in the 3D scene according to the position information returned from backstage to monitoring the position of staff. According to the safe operation area(protective fence in the 3D scene) in the system, combined with the staff’s positioning information, to know whether they are working in the safe area, and if they exceed the safe area to a dangerous area by mistake, a safety alarm is issued to the operator.

Web SCADA

The power wiring diagram of the primary equipment of the substation displayed on the large screen of the main control room, the 2D configuration diagram drawn by the HT technology, can also be upgraded to a 3D configuration diagram, which is more impressive. The voltage and current in and out of the substation and the status of each primary device are displayed in the form of the 3D diagram, 3D animation so that the connection relationship is easy for the public to understand, even for those non-professionals individuals.

Industry Training

Training grid operators along with grid control staff on a dynamic digital twin replica with realistic scenarios mean that when serious faults occur, grid control centre staff will know how to work together as a coordinated team, and which generators and loads could help them avoid outages to maintain a comfortable margin of operational flexibility.

Transformer Assembly Animation

Through 3D virtual simulation of transformer assembly animation, it introduces the working principle and assembly process of transformer equipment, visually displays the composition and installation location of the main components of the transformer, and introduces its main characteristics with text descriptions, which is realistic and technological. This 3D visualization system independently developed by HT can be used as a simulation training material for on-site installation and maintenance of transformers, which can efficiently and conveniently for teaching transformer working principles and new employees training (VR supported).

VR Training

Using HT’s innovative 3D visual modelling techniques to build an interactive environment for isolation switchgear, providing a comprehensive and practical training experience, and better solving the many difficulties and problems faced by professional large-scale complex equipment in employee training. By controlling the operating panel of the isolation switch operating mechanism, the main knife gate, the left floor knife, the right floor knife and other components, staff can intuitively operate the equipment, understand its operation principle, and truly realize 3D interactive simulation demonstration training.

Mobility

Hightopo 3D visualization solution supports cross-platform browsing, which can be viewed by any mobile terminal. Even the operation and maintenance personnel who are not at the work station can also monitor through mobile phones or iPads. This not only reducing material and labour costs but also Improve workforce safety. Mobility is essential for edge grid site which likely has few or no staff on-site.

Conclusion

By transforming unstructured information into a smart digital asset, plant and grid operators are empowered to visualize, build, and manage power systems, sub-stations and facilities of all complexities, ensuring safe and efficient operation throughout the entire life cycle. By using electric network digital twin, utilities are able to shape the operations and maintenance strategies of the future.

Hightopo HT for Web visualization solution increasing asset adaptability and maintaining system reliability while reducing material and labour costs in a critical balancing act and reality for many substation managers. H1elp to gain actionable intelligence and unlock new values of your substation data.

Solar power is clean, limitless and widely available. It’s also getting cheaper. But as with any large system with multitudes of parts, reliability is key. Digital can help. This article introduces a 3d visualization system to monitor the photovoltaic park using ht.js from Hightopo.

Hightopo independently developed a powerful 2D & 3D graphic rendering engine based on HTML5, provided a rich display format and effects for web visualization. Special focus on the Industrial Visualization, Digital Twin, Web SCADA.

3d visualize PV park

The concept of Building-integrated photovoltaics (BIPV) refers to the integration of technology, — refers to the capacity of the photovoltaic (PV) system to be multifunctional — aesthetics — refers to the architectural appearance of the system — , and energy integration, meaning the capability of a PV system to interact with the building and district energy system to maximize the local use of electricity generated.

The BIPV systems can be divided into three main categories:

· PV modules, with specific characteristics, developed for building integration, with appealing features (such as colour, texture, shape, surface finishing, and light materials) conceived for integration in existing buildings.

· Mounting systems, to mount the PV modules on the building envelope, such as on facades, roof, and external devices.

· Energy systems, which link the PV modules to the building and district energy system to maximize the local use of the electricity generated, including storage, power conversion, power control, heating and cooling and e-mobility systems.

Weather Simulation

By utilizing satellite images, aerial views of the property, CAD drawings, on-site photos to create the 3d models, and by using different texture to simulate different seasons( spring, summer, autumn, winter), simulate different time(morning, noon, evening, night) and simulate weather(sunny, cloudy, raining, snowing).

Furthermore, HT visualization system supports integrated with weather data to enable automatic switching of environmental simulation content based on actual weather data.

Visualize Photovoltaic Effect

A standard solar panel (also known as a solar module) consists of a layer of silicon cells, a metal frame, a glass casing, and various wiring to allow current to flow from the silicon cells. Silicon is a nonmetal with conductive properties that allow it to absorb and convert sunlight into electricity. When light interacts with a silicon cell, it causes electrons to be set into motion, which initiates a flow of electric current. This is known as the “photovoltaic effect,” and it describes the general functionality of solar panel technology.

The scene is displayed in a sci-fi wireframe style, highlighting the equipment model, and showcasing the whole process of photovoltaic conversion from light energy to electric energy, power supply to equipment, and energy storage through the flow of lines.

EV Charging Point

Utilizing 3D animation and real-time data to monitor the operating status and real-time power of the EV charging point in the park. Data are visualized in a more intuitive way, for instance, we can determine whether there are vehicles in the current parking space, and the charging status can be simulated through the animation of line flow effects.

When the charging point fails, the corresponding model will be dyed in red colour with warning animation, so that the operators can get a better insight into what’s happing on the site and act faster to reduce the downtime.

Cleaning Robots Animation

Due to the photovoltaic effect, the deposit of dust on the surface of the panels will responsible for obstructing the integral access of sunlight to the system. Therefore, in order to maintain the photovoltaic panel's energy efficiency, using robots for cleaning panels becomes a good go for most solar park.

The cleaning robot is composed of brushes, motors(for brushes and wheels), wheels, photoelectric sensors, and aluminium pipe frame. The robot walks along with the PV panel, high-speed spinning brushes will dust off the surface for cleaning purpose.

VR Roaming Walkthrough

HT for web support drone view or first-person walking view to roaming walk through the park and It’s also VR supported. With the VR device, operators and maintainers will have an immersive experience to inspect the park and spot unusual status.

Hightopo HT for Web is a lightweight, cross-platform, responsive, fully interactive digital twin solution. Empower clients to turn real-time data into insights for better, faster decision making. As the nature of the web-based feature, there’s no need for plugins or downloads, it just works seamlessly on any modern browser & device. With more than 10 years of industry experience, we have collaborated with more than 1000 clients from various industries.

  • Government (Local and Central)
  • Transportation
  • Financial Services (Bank, Insurance Agency)
  • Telecommunications (Data Center)
  • Energy and Utilities (Oil& Gas, Wind Energy)
  • Health Service (Hospital)
  • Education (Institute, University)
  • Real Estate

The manufacturing industry has undergone significant revolutions, now the industry is entering the exciting Industry 4.0. It’s a transition powered by data and automation technology that could transform every step of the manufacturing process. The goal is to drive productivity and innovation and empower businesses in an integrated, data-driven manufacturing environment.

In this article, we illustrate the digital twin visualization system for an SMT assembling production line by the Hightopo 3D Visualization solution. Surface-mount technology (SMT) is a method for producing electronic circuits in which the components are mounted or placed directly onto the surface of printed circuit boards(PCBs).

By utilizing 3D models, users can visualize each piece of equipment, from screen printer, SPI machine, AOI machine, AGV, camera, fire safety equipment, AC and more. By connecting the IoT sensors, data can be collected and analysed and syn together in our visualization system.

Quality Data Visualization

Visualization dashboard — — Statistical Process Control(SPC) — — Quality data is collected and analysed that helps process engineers to improve the current process. The function allows for comparing data from the SPI and AOI systems to conduct parallel analysis. This makes it possible to identify and eliminate the causes of defects.

Assembling Line Visualization

A typical configuration for an SMT assembly process consists of the following automated machines connected in sequence: A Line Loader loads PCBs one-by-one from a stack onto the conveyor belt. A Screen Printer performs the application of the solder paste onto the board. Pick and Place machines select individual components from reels and place them onto the board. The boards are then forwarded to the Reflow Oven which consists of a conveyor belt moving inside a heated chamber. Here, the solder paste melts to form contacts.

Indoor Positioning System(IPS)

IPS refers to the technology that helps locate people and objects indoors. That location information is then fed into HT Visualization System to make the information useful.

Utilizing IoT 5G+, Bluetooth 5.0 and other technologies, and the help of intelligent base stations, wearable devices, the positioning coordinate data is transmitted to the front-end to illustrate the real-time positioning function of personnel and AGV cars. And HT also supports the drawing of historical running trajectories, which help managers analyze the rationality of the production line layout and make corresponding adjustments in time.

Surveillance Video Integration

HT uses the actual position of the on-site camera as a reference and places the model at the corresponding position in the 3D scene to simulate the real world scenario to solve the common issue regarding video surveillance integration and enhancing the value of video applications. Furthermore, use emerging video fusion technology to seamlessly embed video into the scene to truly restore the real scene of the scene.

Conclusion

With modern tools and simulations, new products are first produced virtually these days — offline on a digital twin of your SMT lines, without tests, and without having to interrupt valuable production operations. Long before the first board enters the line, you can define program parameters, teach components, generate setup and pick lists, calculate throughput times, and optimize entire production processes.

Virtual production creates reliability, drastically reduces non-productive activities, improves yields, and maximizes SMT line utilization.

Hightopo 2d&3d visualization solution provides visibility across the entire manufacturing pipeline as data is integrated and displayed through smart IoT technologies. It creates a connected, data-driven manufacturing environment that empowers faster problem diagnosis and informed decision-making.