Economic Networks

A series of posts about those things. Oldest posts first.

This is the third in a series of posts about how to visualize economic networks. After this post, I'll write another comparing those three techniques.

The Social Economy Canvas is a European Community project. Seems to be lots of projects funded by grants from the European Community that are aimed at a better economic system. They must not like the one they got now very much.

The Social Economy Canvas was introduced to the Holo-REA project by Alessandro Rancati.

Alessandro helped to apply the canvas to a Holo-REA user network that was previously used as an example in the Resource Flow diagram blog post. At that time, the network was called Holo-Food, although I think they have renamed themselves to something like Holo-Agriculture.

So here's the Holo-Food canvas.

Holo-Food canvas

To explore the diagram, scroll down on that page (the hyperlink above the picture) until you see it, hover over the picture, and click the Full Screen button, and then Zoom In (it's huge).

The Social Economy Canvas is complex, and really needed Alessandro to guide the Holo-Food crew through the creation of that diagram. But they thought they learned a lot about their project through that exercise.

And the Canvas has some features not found in the previous visual languages in this series.

For example, notice the lightning bolt in this detail screenprint:

Holo-Food canvas detail

It signals that taking food wastes to the biodigestor eliminates traditional waste removal and dumping. The dump fees go instead to the biodigestor, helping to finance its operation.

Note also the different colors. Each has a meaning. An orange arrow suggests unsustainable practices.

The canvas also gets into functional details, like this section about information for seed guardians:

seed info detail

That's as much detail as I will get into in this blog post, but the Canvas website has a lot more: https://webgate.ec.europa.eu/fpfis/wikis/display/SEC/Tutorials

As you can see from those tutorials, the Canvas provides a lot of documentation and procedures for thinking through all the details of an economic network, which should be particularly useful for a new network that wants to form, but also useful for an existing network that wants to explain itself to itself and others better.

And here's a video showing the Holo-Food crew exploring their diagram:

Next post: comparing resource flow diagrams, commons vs capitalism diagrams, and the Social Economic Canvas.

This post will compare the different visual languages presented in the previous posts:

ResourceFlow diagrams

Advantages:

  • Fairly easy: most people we've seen can read them and also create them for their own processes.
  • Fractal: a diagram at one level can be decomposed into its details or aggregated into a higher level diagram, and all of the levels can be precisely related by input and output resource flows.
  • Mathematical (if you need): Category Theorists have rules and code to create, compose (from components), decompose (into components), connect, and analyze them.

Disadvantages:

  • Some of the other visual languages provide more guidance about good and bad economic network practices. Resource flow diagrams can be used for capitalist as well as non-capitalist practices and do not clearly distinguish the bad from the good.
  • The Social Economy Canvas provides a lot of guidance explicitly about economic networks, while resource flow diagrams are more general-purpose (but in the next blog post, guest blogger Lynn Foster will explain how to approach creating resource flow diagrams for economic networks).

Commons vs Alienated Production diagrams

Advantages:

  • The simplest to read, once you understand the ideas, which are pretty clear.
  • Clearest distinction between good and bad practices.
  • Comes with some clear economic theory about Generative Justice.

Disadvantages:

  • Does not depict any of the details of your economic network.
  • Would need to be accompanied by a lot of explanatory text (or other diagrams).

The Social Economy Canvas

Advantages:

  • Provides the most guidance about how to create your own economic network canvas. (Especially if you have Alessandro Rancati to help you.)
  • While not exactly fractal, does provide methods of diving into the details of different parts of a canvas, as well as creating other diagrams to explore other aspects of a network.
  • Provides features for differentiating bad practices as well as showing how features of a proposed network will eliminate some existing bad practices.
  • The color codes are helpful in navigating the diagrams.

Disadvantages:

  • In practice, creates huge diagrams which would be easier to read as wall posters, compared to resource flow or commons vs alienated diagrams, which can be smaller and simpler.

Conclusion

Would be good to incorporate the contrasts between good and bad practices into resource flow diagrams, which appear to be the most flexible technique.

And some color codes would be nice.

This is a guest post from Lynn Foster, one of the authors and maintainers of the ValueFlows economic network vocabulary. In the fediverse, she is @lynnfoster@social.coop

These are some thoughts about how to model resource flows in an economic network. These models can be done at different levels of detail, depending on your purpose. It is often most useful to start with less detail, to understand the general shape of your network, then proceed to more detail. But don't worry, however you think about it naturally is likely to be the best – just get started!

Side note: This set of techniques map very generally to the ValueFlows vocabulary. But this post is not meant to be a tutorial on ValueFlows. Rather it is a guide for people starting to think about the resource flows involved in their community, supply chain, circular economy, municipality, bio-region, whatever. It can be a step in considering software to support a network based on resource flows, or not.

We will use a proposed co-op to produce olive oil in Palestine and sell it in Europe as an example.

Agent Roles

Agents are people or organizations (formal or informal, including networks). Agents can of course play many roles in the world, but this looks at the roles agents play in relation to the scope of the model. You can even include actual agents if they are important to the model, but that would be less usual. Agent roles are a good place to start thinking about this, but as in all the steps that follow, don’t worry too much, everything can be adjusted as you continue to model.

So, for our olive oil example, we might have these agent roles:

  • farmers
  • processors
  • transporters
  • distributors
  • consumers

It is good to start with roles that one agent would play. So for example if there are two main processes done by processors, pressing and bottling, and those are done by different agents, those should be two roles, pressers and bottlers. But if the same agents always do both pressing and bottling, those might be combined at the start, as we have done here. This is a good rule of thumb, but by no means absolute. As always, this kind of choice should reflect the way you think about it naturally, and the way people involved tend to talk about it.

Types of Processes

Processes can be thought of in many levels of detail. It is often helpful to start with higher levels, levels that roughly correspond to the agent roles, but are verbs. So in our example, we might have

  • Tend
  • Harvest
  • Process
  • Transport
  • Distribute
  • Consume

Notice that both tending the trees and harvesting the olives are included here, even though we only have a farmer role, since those are usually managed by the same agent at a high level. But the processes are so distinct in time and methods that we decided to separate them.

High Level Resource Flows

Now we can start to draw some high level flows using the types of processes. We will want to connect the processes with resource flows. These will start to show the types of resources at a high level. If quantities are known, say per a time period, that can also be very useful. It is often easiest to start with the main flows, to see how types of processes will generally connect. If all processes aren’t connected by resource flows, perhaps something is missing. Here is what this example might start to look like.

high level flows

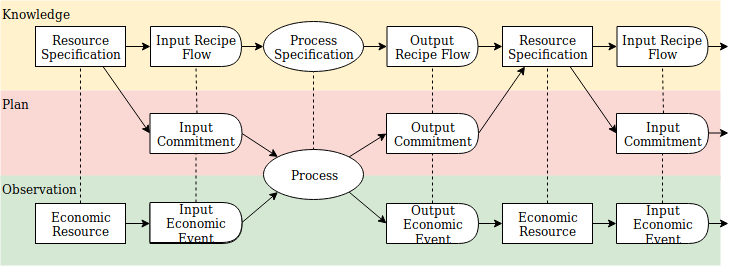
Notice that this is a static view – it is showing general concepts, not potentially real activities and things. This could be called conceptual vs. concrete, or software developers might understand this as classes vs. instances. I’ll call them static vs active in this document.

For these simple flows, a static view like this is often easier.

Active Resource Flows with Agents

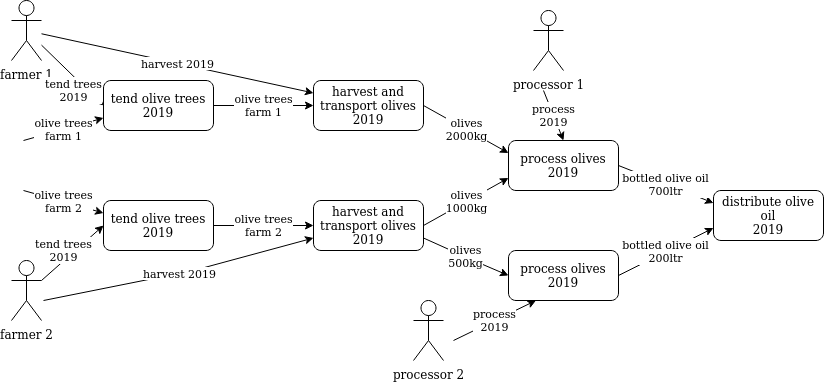
To move to a more detailed understanding, it is often helpful to model example flows, with a few hypothetical (or real) agents, processes, and resource flows. This diagram is usually still stereotyped, but better as an active view. It will start to give you a “graph” of your flows, with some understanding of the possible complexity of the network.

Here is a simplified example of part of the above flow shown as hypothetical concrete instances, using names, dates, and quantities to exemplify that. One key piece of additional information is how the different types of process can split and combine in the network. In this example, there can be many growers, who can send their olives to one or more processors. Any number of farmers could take their olives to any number of processors. This network has only one distributor, so that is shown as one.

flows with agents

Adding More Input and Output Flows

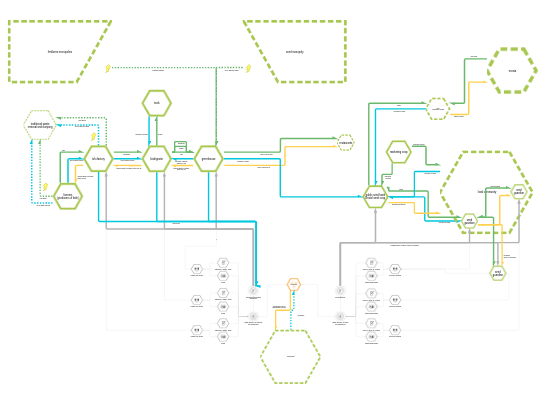
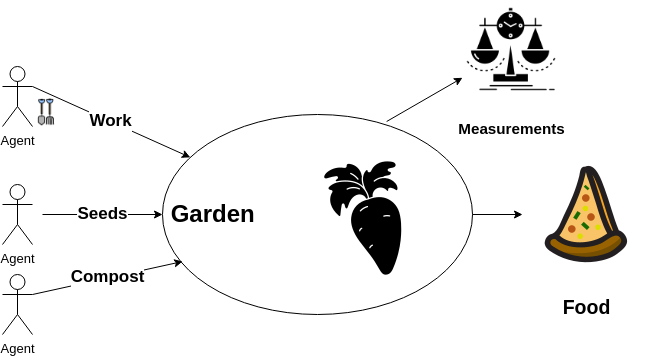
It also can be useful to start to show other inputs and outputs besides the main flows. That could be added into the above view if it doesn’t get too messy. But we’ll show a smaller piece of the overall flow diagram with a more complete set of flows. Sometimes this will be more an internal view for an agent, but is also useful in developing a more robust view of the economic networks created by these operations. This kind of effort could be shown in a static and/or an active view, depending on the needs. We jumped back to a static view here for simplicity.

more flows

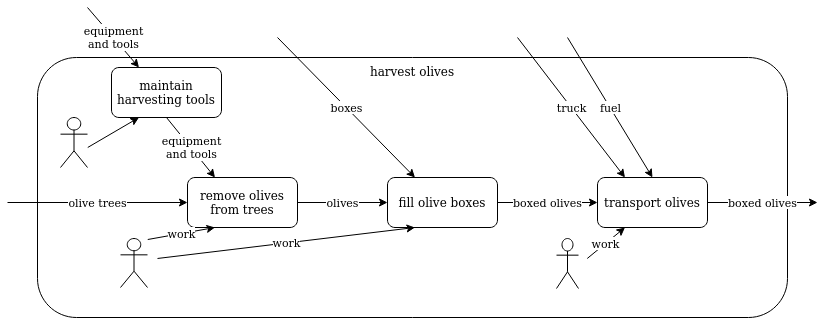
Note that transporting the olives to the processor is shown as part of harvesting. It also could be outside of harvesting, if a different agent does the transportation, especially if that agent does transportation for other growers too. If so, we have discovered an addition to the first simple diagram in between harvesting and processing. There are probably more flows that could be discovered involved with the transportation also, perhaps involving the truck, which also needs maintenance for example.

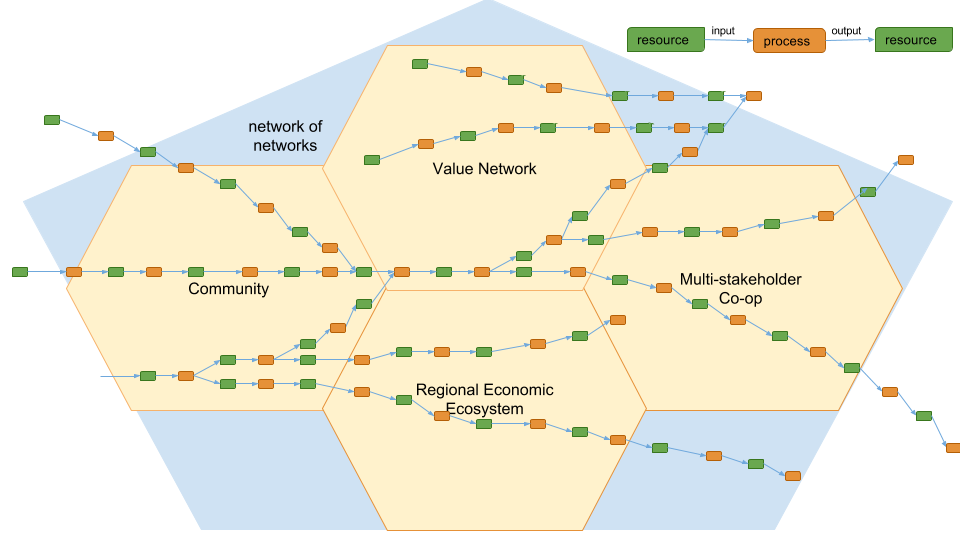
And to emphasize again, these models can be done at many levels of detail – depending on your purpose and stage in thinking. And they can be done to include an ever expanding scope of related networks, including a whole community, as more and more inputs and outputs are identified. This could help the whole community coordinate their own economy, potentially increasing localization and fairness.

Reciprocity

So far we have been looking at producing olive oil and getting it into the hands of the people who will consume it. Usually when modeling a network or ecosystem, there will also be some form of reciprocity. The most prevalent today is exchanging something useful for a currency. People are also experimenting with creating newer currencies, like crypto-currencies or local currencies. People are also experimenting with mutual credit, where the credits are exchanged for some useful good or service, and people basically keep track of the credits in a ledger, trying to keep the reciprocity relatively equal. Some people do a lot of barter or gifting, either formally or informally.

Also, if people are using currencies, there are experiments on how to make those exchanges more fair. Again, the most prevalent current practice is a sale/purchase of end-use or intermediate products and services, based on “price” either declared or negotiated between the two agents involved.

One experiment is called a “contribution economy”, where all the actual flows are transparent, and when a product or service is exchanged for some currency (or something else useful), that flows back to the contributors according to a (preferably democratically) decided formula. Another prevalent method in cooperative supply chain networks of small producers is to make the exchanges as the product or service is produced, which requires negotiation and transparency so that all are treated fairly, but does not delay the reciprocal exchange.

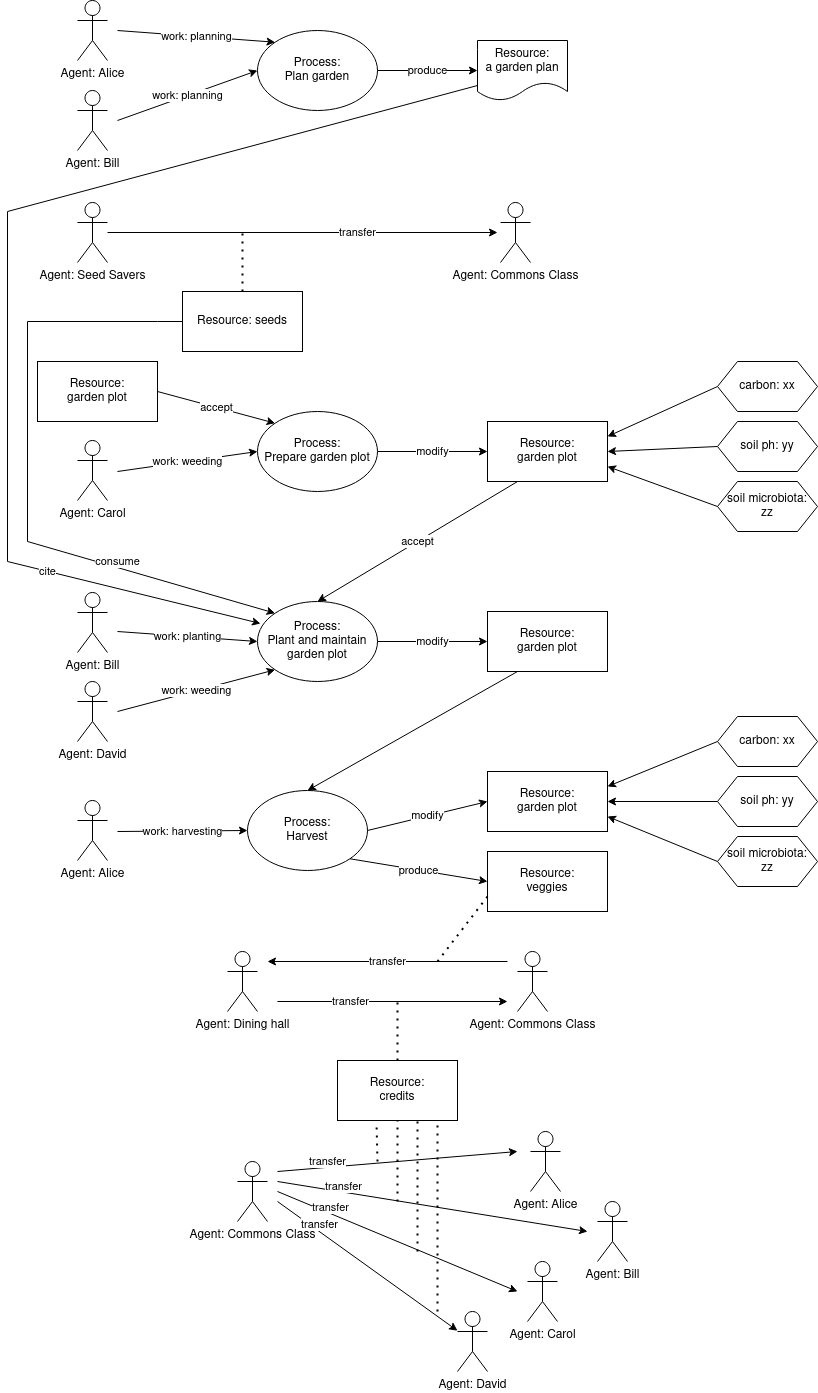
Modeling the flows can be part of these kinds of discussions. Let’s go back to the high level to see how we might want to model the reciprocal flows for the olive oil cooperative network, which plans on selling into the current market. This simplified example is based on a contributory economic network.

reciprocal flows

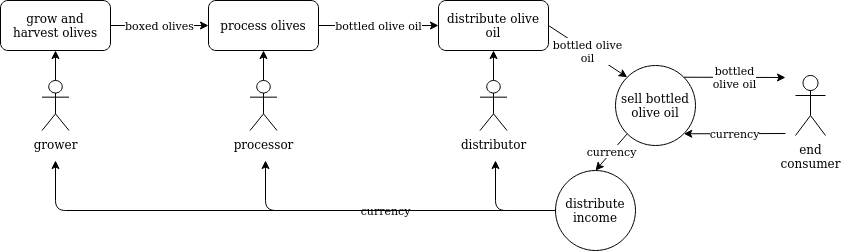
Here’s another example where each agent exchanges their produced resource for currency as it is delivered along the process flow.

agent exchanges

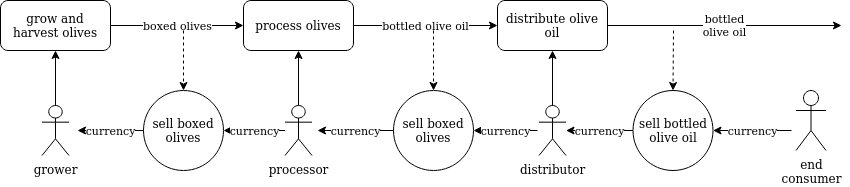
Other kinds of exchanges would also occur along the way, for example purchasing boxes, borrowing a truck.

The End (for now)

We hope this has been helpful for people in networks who are just starting to figure out their resource flows and how to document them. This is a first draft, suggestions for improvement big or small, or just pointing out where things are unclear or missing, are very welcome!

You can comment in the fediverse either to @lynnfoster@social.coop or @economic-networks@write.as

A fractal is a structure that is similar at every scale, like a fern, where the shape of the whole plant is similar to the shape of each branch, which is similar to each frond on each branch.

Barnsley fern

That fern was generated on a computer by Michael Barnsley, but the real ones are like that, too:

real fern

An economy at every scale contains processes which take existing resources as inputs and from them, create new resources as outputs.

fractal processes

So for example, a gardener does some work (a resource) and takes some seeds (resources) and plants them in some soil (a resource) and feeds them some compost (a resource created by decomposition from other resources that otherwise would have been wasted) and the seeds enjoy some water and sunlight. The seeds eat the compost and drink the water and use the sunlight as energy and develop into a plant. Maybe a tomato plant. The gardeners eventually harvest the tomatoes, which are the outputs created from all of those inputs via that process.

And of course you could zoom into that whole process and see smaller processes, for example, in each seed, as it develops into a plant. See germination process.

The tomato plant is grown on a farm. It is a community farm, which is organized as a Solawi. This particular Solawi is named Radiesli.

As the gardeners work, they are serenaded by a violinist and a pianist playing on on a stage carried by a forklift.

Radiesli

So the inputs to the whole process of planting include the work of the gardeners, the seeds, the soil, the compost, the sun and rain, and the musicians carried on the forklift.

The outputs include more than tomatoes, but some of the tomatoes become inputs to pizzas baked in the community pizzeria, which feed the hungry gardeners and musicians. And many more tomatoes and other Solawi outputs feed the surrounding community.

But at a larger scale, the whole Solawi requires inputs of money, because many of the other inputs need to be purchased from the surrounding capitalist economy. The Solawi is financed by its members, who participate in yearly budget negotiations between the farmers who figure out how much money will be needed and the community members who will provide the funds. Typically, it takes several rounds of negotiations before everybody agrees to the budget.

Johannes Winter describes the budget negotiation rounds and also some of the ways Solawis are expanding in this paper: https://cld.freedomhost.de/index.php/s/FJF4iLFWFYbXrCB

The way that Solawis work has become so successful that their practices are spreading out to cover more than food, to community-managed economies.

From https://gemeinschaftsgetragen.de/

“Solawi...works according to the principle of sharing costs and harvest: A group of people forms a community and allocates the entire running costs of an agricultural operation to all members. This changes the relationship between consumers and producers – they share the risk and responsibility for the production of the food and the development of the organization. The products are no longer sold for a market price, but distributed to the members, because the running costs are already covered by the members' contributions.

“This principle can also be transferred to other areas – from a jointly funded health center to energy supply, crafts, gastronomy and creative services to providers of leisure activities.”

CSX

I think growing up and out from the roots would make the most sense. Like from food crops to food processing to cafeterias: maybe first the school cafeteria and later an open community cafeteria. From using farm equipment to repairing farm equipment and then producing farm equipment, maybe by mining junkyards for inputs. Start to use mutual credit and/or a community currency instead of the coin o' the realm. Maybe somewhere in that process the capitalist system becomes irrelevant.

I'd like to live in such a community.

This is based on the Valueflows vocabulary, which defines the terms Economic Event and Agent.

An Economic Event is an event that affects an Economic Resource, like cut up some apples (consuming some resources, apples) and bake them into a pie (creating a new resource, an apple pie).

An Agent has agency and can perform Economic Events and reach agreements with other agents. An Agent could be a person or an organization.

This protocol is for Economic Events that involve more than one Agent, usually a Provider and a Receiver, and the two Agents are operating as different nodes in a distributed computing network with or without a shared database.

The goal of the protocol is to reach agreement between the provider and receiver on the Economic Event.

Reaching such an agreement might seem easy, but it can be difficult in a distributed computing environment. See https://en.wikipedia.org/wiki/Fallacies_of_distributed_computing

One of the components of this protocol will be a Distributed Ledger, and the interaction pattern is sometimes called Triple-Entry Accounting. 

Triple-Entry Accounting is an idea mostly attributed to Ian Grigg: https://www.iang.org/papers/triple_entry.html

Distributed Ledgers are often implemented on blockchains, but this protocol will be technology-agnostic. The first implementations will be on Holochain and ActivityPub networks, which are really distributed, while blockchains are just multiple copies of the exact same data. (However, this protocol could also be implemented using a blockchain. It's agnostic.)

Likewise this protocol will differ in two ways from Ian Grigg's original proposal.

One difference is that Ian assumed a blockchain, while this proposal doesn't. The triple entries in Ian's proposal were one for each trading partner and a third on the blockchain as a distributed ledger.

The other difference is that Ian used double-entry accounting in one version of his proposal, so his trading partner entries had two entries each, making it really 5-entry accounting. This protocol assumes REA, which is an ontology for multi-agent accounting that records each entry once and only once from three different views: one for each trading partner, and the “independent view”, recorded on a distributed ledger. So it's like Ian's Single Entry version.

But REA is smart, so from the single entry, using its ontology, it can figure out all of the customary accounting reports as well as new analytical views of the data in the distributed ledger. See Accounting and Algorithms in the Valueflows documentation.

This paper REA, Triple-Entry Accounting and Blockchain: Converging Paths to Shared Ledger Systems explains the background and reasons for this protocol in greater detail. The description below summarizes the interaction steps in that paper.

Here's another shorter article about the same ideas: Blockchain and eBusiness

The Protocol

Each Agent has its own private ledger, where each of them records their own views of the Economic Event.

The Provider signs and records the Economic Event in their private ledger, and sends the Economic Event record to the Receiver as well as to the Distributed Ledger.

The Receiving node signs and sends an acknowledgment that they got the Economic Event record. (This is just a communication acknowledgment, that the message was received by the Receiving Agent's network node.)

If the Provider does not get the Ack, they can resend, but that means the implementations need to use something like Mike Nottingham's POST Once Exactly (POE). Easiest way is probably unique message numbers on all messages and ignore duplicates coming in.

Then the Receiving Agent validates the Economic Event, and signs and sends either a valid or invalid message to the Provider as well as the Distributed Ledger.

Sometimes validation will require a human. For example, if the Economic Event reports a resource delivery, and the resource was not really delivered, or was the wrong resource, or damaged, or defective in some way, human judgment could be better than computation.

If valid, the Distributed Ledger signs the Economic Event record, which has now been committed, and this iteration of the protocol is finished.

If invalid, the two agents will need to engage in a conversation to either resolve the problem and send a validation message to the Distributed Ledger, or give up.

Distributed implementations

Holo-REA

Here's an overview from the developer, Pospi.

Using the Holochain “agent-centric” architecture, each Agent has their own Source Chain where they post their own views of the Economic Event. They also post the “independent view” of the Economic Event to the Holochain Distributed Hash Table (DHT), “A Public Distributed Database”.

The DHT is the shared Distributed Ledger. Pospi calls that “the community view”.

Bonfire

Bonfire is an implementation of ActivityPub (mentioned above with a link).

In that architecture, each Agent will have its own Inbox and Outbox. So the Provider will send the Economic Event record to the Inbox of the Receiver, and the Receiver will send their messages to the Inbox of the Provider.

The Distributed Ledger will be a Valueflows Scope, which will have its own ActivityPub Inbox and Outbox, and will save validated Economic Event and other economic records which reference the Scope. (If no Scope, no distributed ledger.)

One of the early use cases for the Bonfire Valueflows Distributed Ledger will be EveryCycle, a citizen-participation app for the Reflow project, creating circular economies in European cities.

EveryCycle Distributed Ledger

ecosystems = networks

The quote and diagram came from Patten, B.C., Witkamp, M., 1967. Systems analysis of Cesium kinetics in terrestrial microcosms. Ecology 48, 813–824.

The first two slides and a lot of the info in this post came from John Baez: Theoretical Physics in the 21st Century

No waste in nature

So that means (paradoxical? (not)) if humans dump their “wastes” into their surrounding ecosystems, they will go somewhere, and be used or eaten by something. But the humans might not like the results.

Like their excess nitrogen fertilizers feeding algae blooms in the Caribbean and killing off the shrimp which the humans wanted to eat. (But the algae were happy...) Or their excess carbon emissions causing global warming such that the tropics will become uninhabitable in their lifetimes, thus triggering massive human and animal migrations to cooler regions, with probable wars and more pandemics from zoonotic diseases like the current coronavirus. (But the viruses are happy...)

In Part 2, we'll try to make this a happier story for the humans (and shrimp, but maybe not the algae and viruses...)

This is not a design for Valueflows UI or UX but a discussion of what kinds of UI/UX might be possible, appropriate, and useful.

This will get long. Sorry. I'll pull it back to UI/UX considerations after some background. And contrast a bit with the popular Trello-style UI.

Valueflows might have been named “resource flows” because that is what they are really about. The name “Valueflows” got the most votes when the first group of contributors wanted to set up a website and needed a name. So it's https://valueflo.ws/ forever.

But it's really about flows of Economic Resources: following their movements back to their origins and planning and executing their movements into their futures. Stuff in motion, but not randomly. Stuff moving on paths that you create, and you also control the movements of the stuff.

The structure is sets of input-process-output networks, where the processes are loosely connected when the output resource from one process becomes an input resource to another process.

That same structure repeats on three interconnected levels:

VF levels

So on the Knowledge level, a Process Specification is loosely connected to another Process Specification when the Resource on its Output Recipe Flow matches the Resource on the Input Recipe Flow of another Process Specification.

Or on the Plan level, Processes are loosely connected when the Resource on an Output Commitment from one Process matches the Resource on an Input Commitment to another Process.

To be a bit more concrete:

salsa levels

Why are the processes loosely, rather than tightly, connected?

For example, why don't we just say that the first process is harvesting tomatoes, the second process is dicing tomatoes, the third process is cooking salsa, and the fourth process is packaging salsa?

Because process flows are not always linear or predictable, and the resources from one process can go into more than one other process.

For example, maybe when the tomatoes are harvested, some of them go into salsa, some into spaghetti sauce, some into salads, etc. And sometimes when they are harvested, their next processes have not all been decided.

User Perspectives in the Resource Flows

A user might might interact with those flows at any node on any level.

For example, a user might want to create a Recipe. Or generate a Plan from a Recipe. Or create a Plan without a Recipe. Or manage a Process. Or execute an Economic Event (for example, dice tomatoes).

Or a user might want to work at an even higher level, analyzing all of the resource flows in a Solawi (a community farm, see https://write.as/economic-networks/a-fractal-economy ) or all of the flows in a whole community, including a lot more than food.

I'm thinking of something vaguely, but not exactly, like how a Miro board includes an overview of the whole board in the bottom right corner, showing an outline around the part of the board which you have in focus.

Miro board

What does all that mean for UI/UX?

Let's contrast with a Trello “kanban” card UI. The cards often represent “tasks”: work for people to do. Tasks are not the same as Processes: a Process might have several “tasks” (work for people to do) as well as other inputs and outputs.

The cards are arranged in columns, which usually represent management statuses, like Backlog, Doing, Done, etc. And moving a card from one status (one column) to the next happens by user action on the UI, regardless of the actual status – or dependencies – of the work. For example, somebody might move the Dice Tomatoes task to the Doing column, but the tomatoes have not yet been harvested, so no tomatoes can be diced.

The vertical columns also do not show horizontal flows. So the Doing column might contain tasks for making salsa, baking bread, and making apple pie, while salsa, pie, and bread have separate process flows that do not intermingle.

I depend on somebody else, and somebody else depends on me

Also, each process in each of those flows has its own dependencies – what resources from which previous process need to be available before this next process can begin – and those dependencies are also invisible on the Trello UI.

So a better card interface might include horizontal rows in addition to vertical columns, and some kind of signal whether the resource requirements for a process are available so some work can actually begin. Or who's waiting for the resources you are working on.

Likewise a given person might have committed to do some of the work on a Trello UI, not not all of it. So another useful view might be My Work: what work have I committed to do, and are all of its required resources available? And why am I doing that? Where are the output resources going?

Yet another view might be from larger perspectives: where does this task or Process fit into a whole project, organization, community, or regional economy?

None of this discussion wants to suggest that a Trello-like card UI is the perfect choice for any and all situations. More analysis and more imagination might suggest totally different alternatives. But in Valueflows, those resource flows, on different levels, from different perspectives, are what you got to work with.

Yes, the hip kiddies these days say “don't design your UI from the data model”, but in this case, the structure described above is also the structure of the real-life flows, and is not the same as the data model.

Yet another angle

Experience has shown that all work and no play makes for dull experiences. And purely economic user experiences want to be intermingled with conversations about the economic stuff and also conversations about organizational issues, governance, global politics, the latest protest, the current fave entertainment, and what's going on with your health, family, garden, environment, etc etc.

Here's a previous discussion of combined social + economic UI/UX.

Some creative work will need to be done about how the economic and social interactions intermingle.

This is one of the two basic patterns of Valueflows. One Process is connected to other Processes when the output Resource of that Process becomes an input to the other Processes.

Schematically, that is: (P)–>[R]–>(P)–>[R]–>(P)–>[R]–>etc.

Track and trace follows those flows forwards and backwards from a starting point, usually a Resource, somewhere in the flow.

That same pattern occurs on all three levels of the Valueflows vocabulary: Knowledge, which describe how processes work. Plans, which describe processes which are intended to happen. And Observation, which is a record of processes that have already happened.

So on the Knowledge level, that's: (ProcessSpecification)-OutputRecipeFlow->[ResourceSpecification]-InputRecipeFlow->(ProcessSpecification).>etc

Or on the Plan level, that's: (Process)-OutputCommitment>[ResourceSpecification]-InputCommitment>(Process).>etc

3 level spec

Here is an example:

salsa example

Those flows can connect different people, organizations, and even ecosystems, into networks of networks:

network of networks

That same IPO pattern is used in many fields of study and analysis, as you can see from https://en.wikipedia.org/wiki/IPO_model . IPO use for https://en.wikipedia.org/wiki/Material_flow_analysis is almost the same as we use it in Valueflows.

  1. Resources, Events, and Agents (REA)
  2. Input-Process-Output Resource Flows (IPO)

In general, how they fit together: Agents perform Economic Events that provide Inputs to Processes and take Outputs from Processes and move Resources from one Process to another.

Here is a true story about the resource flows in a garden class that will be held this year in at least one and maybe more than one US university:

garden flows

Here are a lot more details about that garden class. You might want to open this diagram in a different tab and enlarge it to make it more readable.

garden class details

The students in that class will provide work to prepare and plant a garden plot and then harvest the food, and the food from the garden will go to the school cafeteria. The students will earn credits from their work, which can be exchanged for meals in the cafeteria.

So we have inflows of work and seeds going into a garden plot, and outflows of food and credits. The food becomes inflows to the cafeteria, which becomes outflows of meals for the students, and credits become inflows to the students which they exchange with the cafeteria for the meals.

This is one of the two basic patterns of Valueflows.

This will be a quick overview of REA. Here are a lot of references explaining the history and development of this pattern: https://www.valueflo.ws/appendix/rea/

The main concepts of REA:

REA main concepts

An EconomicEvent generally includes one type of EconomicResource (which might be a lot of the same ResourceSpecification) and two EconomicAgents. In a Transfer EconomicEvent, one Agent gives the EconomicResource or Resources to another Agent. In a Transformation, which ValueFlows calls a Process, one Agent provides some EconomicResources as inputs and either the same or a different Agent takes some transformed Resources as outputs. (A Process will almost always have at least two EconomicEvents, an input and and output, and often several more inputs and sometimes more outputs.)

Duality is an abstract concept that basically means “why did the Agent give up those Resources”. In a Transfer, it might be to get some other Resources in exchange from the other Agent. In a Transformation, it is to get an improved or different Resource as an output of the Process.

REA defines three different levels of similar concepts:

REA levels

Those are the Valueflows (VF) names for the concepts. In the REA references linked above, you will see different names;

  • VF:ResourceSpecification = REA:ResourceType
  • VF:Process = REA:Conversion

VF:Recipe and VF:ProcessSpecification do not exist (yet) in REA literature.